StarRocks vs ClickHouse: Which Analytics Engine Suits Your Workload?
Last week we published an architecture-first comparison of StarRocks and ClickHouse: storage engines, scaling models, optimizers, updates, lakehouse support. The most common reply we got was some version of:
"Great, but I have this workload. Which one should I use?"
That's the right question. Nobody runs "an analytics database" in the abstract. You run logs, or seller dashboards, or a CDC-fed order table, or a finance star schema, and very often all of them at once. Both engines are excellent. Each one is excellent at different shapes of work.
So this post starts from the other end. Instead of comparing features, we'll:
- Fingerprint a workload along the seven dimensions that actually decide the choice
- Walk through six common analytics workloads, with schemas, queries and dummy numbers from a fictional company
- Score both engines with a weighted scorecard (and show how the same scores flip with different weights)
- Look at real migrations in both directions, and what they really tell you
- Decide between one engine or two
- Run a two-week bake-off that gives you an answer you can defend
Versions covered: ClickHouse 26.10 (released October 24, 2026) and StarRocks 4.1. Both move fast, so check the release notes for anything newer.
Meet Tulipa Commerce (our dummy company)
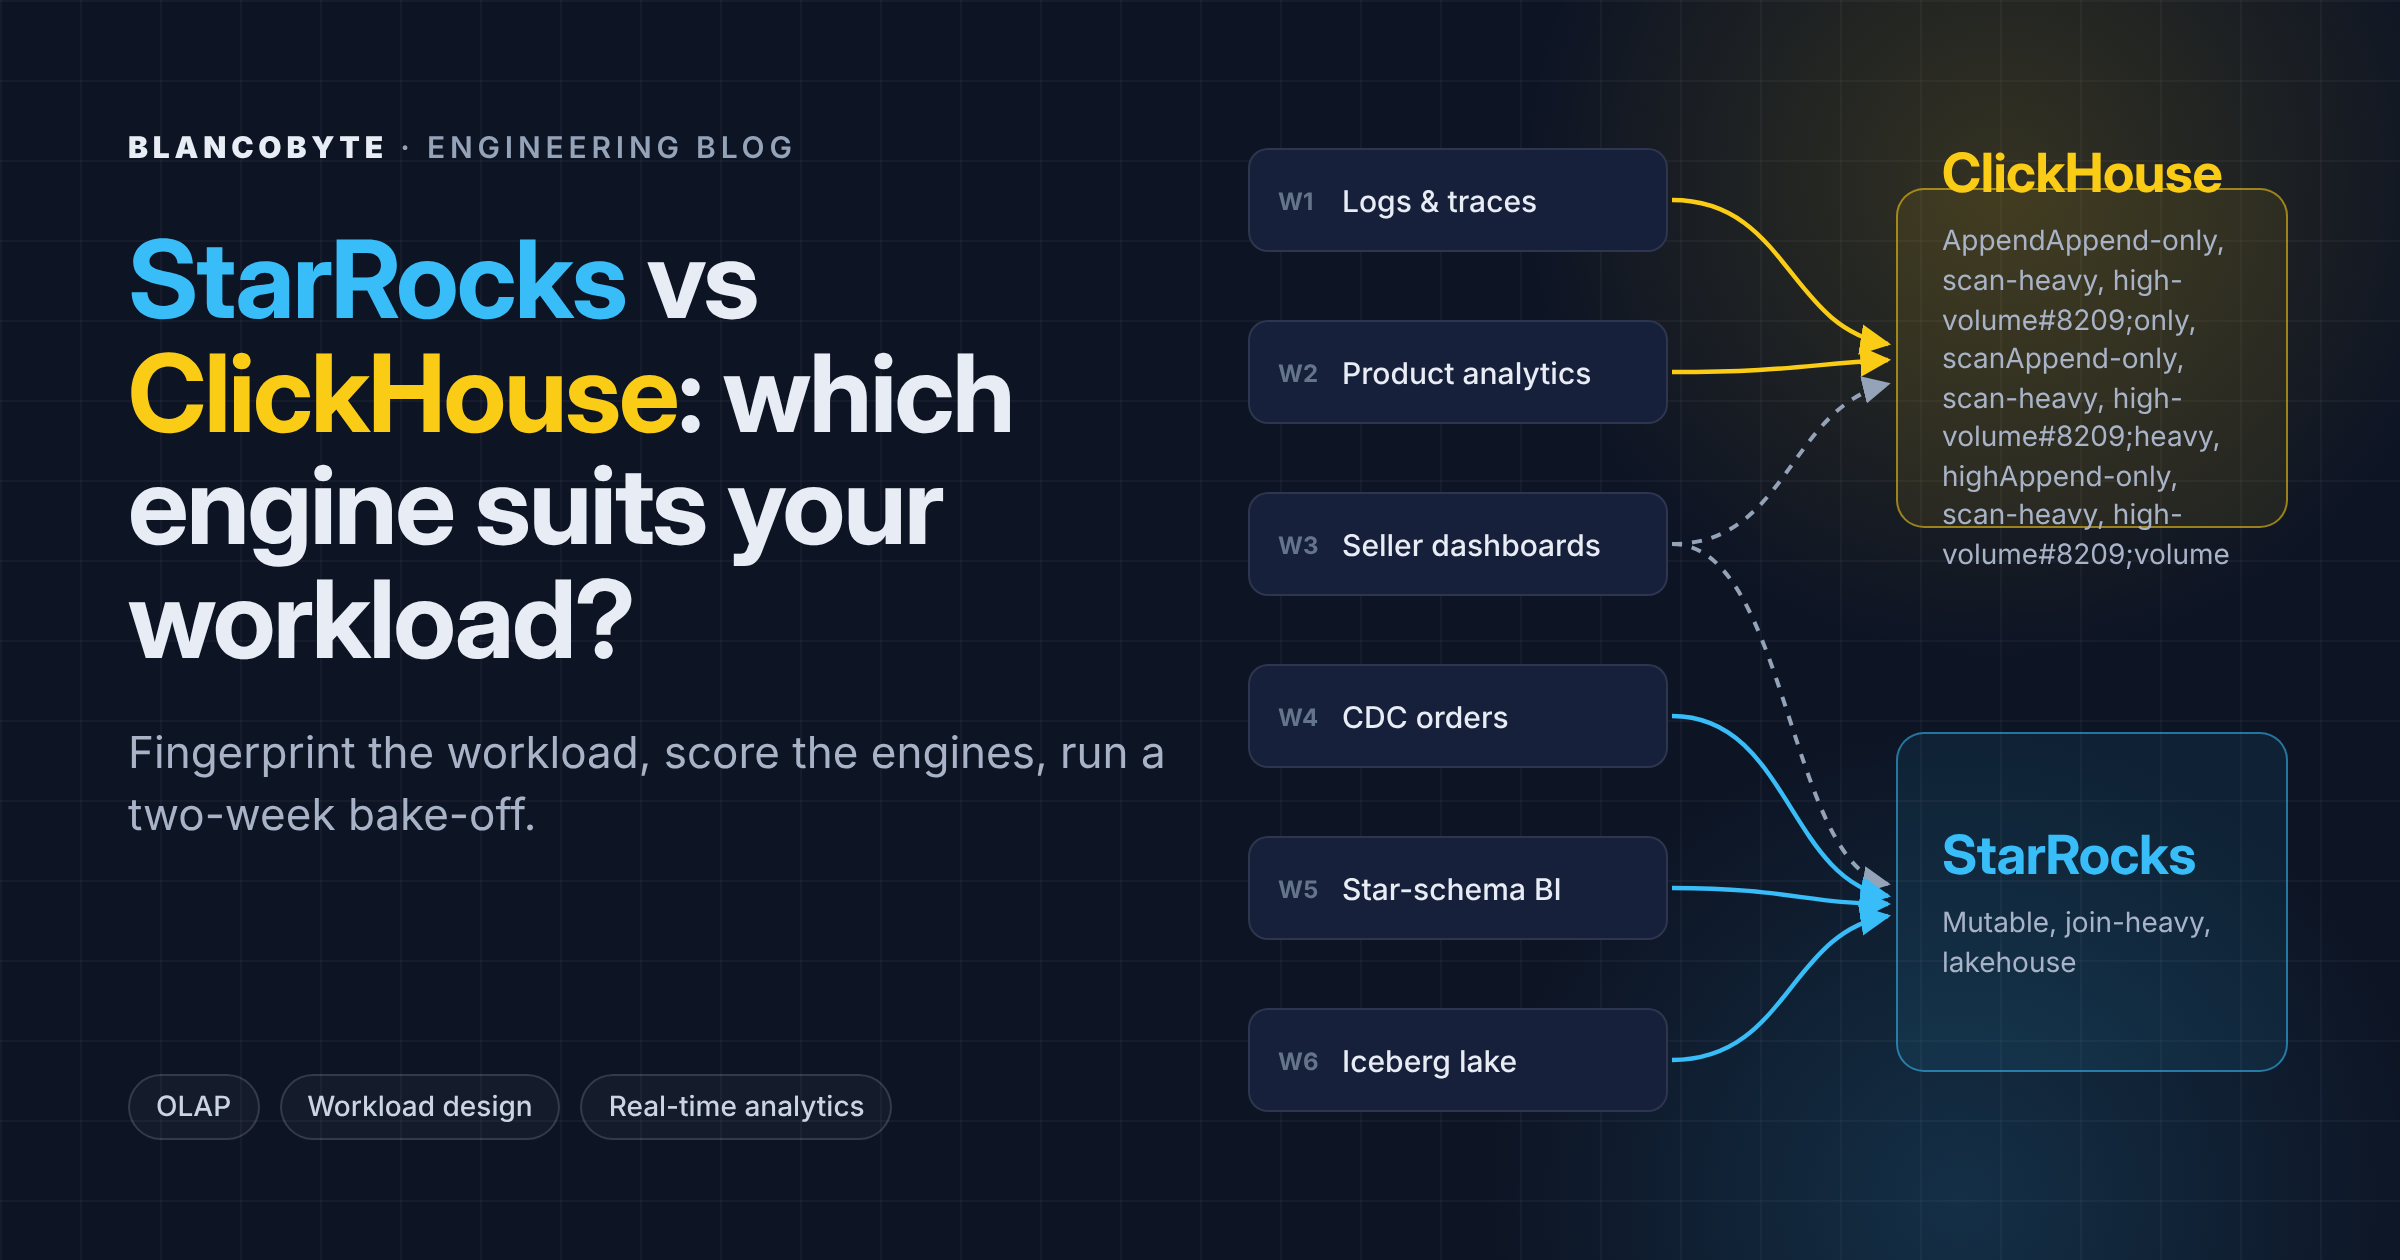
To keep things concrete, we'll use a fictional company throughout the post. Tulipa Commerce is a European marketplace: 12,000 sellers, a few million shoppers, a mix of Kafka, PostgreSQL and an Iceberg lake on S3. Its data team has six workloads on the table.
| # | Workload | Dummy numbers |
|---|---|---|
| W1 | Platform logs and traces | ~40 billion log lines/day (~8 TB raw), peak 900k lines/s, 30 SREs querying during incidents |
| W2 | Product analytics (funnels, retention) | 2 billion clickstream events/day, 25 product managers, mostly single-table |
| W3 | Seller dashboards (customer-facing) | 12,000 tenants, peak 2,500 dashboard loads/min × 12 queries each |
| W4 | Order and payment facts fed by CDC | 4M orders/day, each row updated ~5 times (paid, shipped, delivered, refunded…) |
| W5 | Finance BI on a star schema | 6B-row fact table, 9 dimensions, 40 analysts, queries join 5–8 tables |
| W6 | Lake acceleration | 1.2 PB in Iceberg, owned by the data platform team, queried by BI and data science |
All numbers in this post are illustrative. They're realistic for a mid-size company, but they're not from a real customer.
1. Fingerprint your workload first
Before looking at either engine, describe the workload. These seven questions explain most of the outcomes we see in practice:
| Dimension | Question | Leans ClickHouse when… | Leans StarRocks when… |
|---|---|---|---|
| Data shape | One wide table, or a normalized schema? | One wide, denormalized table | Many tables joined at query time |
| Mutability | Do rows change after they land? | Append-only, or rare corrections | Frequent upserts, deletes, partial updates |
| Query shape | Scans and aggregations, or joins? | Big scans, time-bucketed aggregations, text search | Multi-table joins, fact-to-fact joins |
| Concurrency | How many queries at once? (QPS × latency) | Tens to low hundreds, or high QPS with careful modeling | Hundreds to thousands, with little per-query tuning |
| Freshness | Seconds or minutes? | Seconds, append-heavy streams | Seconds, with updates that must be visible immediately |
| Data location | Native tables or a lake? | Hot data in native tables, lake as a source | Lake (Iceberg) as the system of record |
| Team and ops | Who runs it, and how? | Small team, single server, or ClickHouse Cloud | Self-managed cluster that should rebalance itself |
The concurrency row needs a number, not a feeling. Use Little's Law (we went deeper on this in our ClickHouse high-concurrency tuning guide):
concurrent queries ≈ QPS × average execution time
For Tulipa's seller dashboards (W3): 2,500 loads/min × 12 queries = 30,000 queries/min = 500 QPS. At 60 ms per query that's about 30 concurrent queries. At 600 ms it's 300. The same product, two very different database problems. Making queries faster changes the answer more than choosing an engine does.
Here's Tulipa's fingerprint for all six workloads:
| Shape | Mutable | Joins | Concurrency | Lake | First lean | |
|---|---|---|---|---|---|---|
| W1 Logs | Wide | No | Rare | Low | No | ClickHouse |
| W2 Product analytics | Wide | No | Rare | Low | No | ClickHouse |
| W3 Seller dashboards | Mixed | Some | Some | High | No | Either (depends on W4) |
| W4 Orders (CDC) | Normalized | Yes, heavily | Yes | Medium | No | StarRocks |
| W5 Finance BI | Star schema | Some | Heavy | Medium | Partly | StarRocks |
| W6 Lake acceleration | Normalized | Via Iceberg | Yes | Medium | Yes | StarRocks |
Now let's look at each one in detail.
2. Workload by workload
W1. Logs, traces and observability → ClickHouse
This is ClickHouse's home turf, and the gap here has grown, not shrunk.
Why it fits: observability data is append-only, enormous, and queried by time range plus a few dimensions. That's exactly what the MergeTree engine, compression codecs, skip indexes and the text index were built for.
CREATE TABLE logs
(
    ts           DateTime64(3) CODEC(Delta, ZSTD(1)),
    service      LowCardinality(String),
    level        LowCardinality(String),
    host         LowCardinality(String),
    trace_id     String,
    message      String CODEC(ZSTD(3)),
    attributes   Map(LowCardinality(String), String),

    INDEX idx_trace   trace_id               TYPE bloom_filter(0.01) GRANULARITY 1,
    INDEX idx_msg     message                TYPE text(tokenizer = splitByNonAlpha),
    INDEX idx_attr_k  mapKeys(attributes)    TYPE bloom_filter(0.01) GRANULARITY 1
)
ENGINE = MergeTree
PARTITION BY toDate(ts)
ORDER BY (service, level, ts)
TTL toDateTime(ts) + INTERVAL 30 DAY;
A typical incident query:
SELECT
    toStartOfMinute(ts) AS minute,
    service,
    count() AS errors
FROM logs
WHERE ts >= now() - INTERVAL 30 MINUTE
  AND level = 'ERROR'
  AND hasToken(message, 'timeout')
GROUP BY minute, service
ORDER BY minute;
Dummy sizing for Tulipa: at a 12–15× compression ratio (common for structured logs), 8 TB/day raw is roughly 550–650 GB/day on disk, or about 18 TB for 30 days of hot retention. A small ClickHouse cluster with tiered storage handles that comfortably.
Real-world reference points:
- OpenAI's observability backend runs on a ClickHouse cluster of 90 shards with two replicas each, ingesting petabytes of logs per day, with older data offloaded to blob storage (ClickHouse blog).
- Twilio described at Open House London (September 2026) how ClickHouse Cloud handles about 30 million log lines per second at peak and a petabyte of raw logs per day (video).
- Vercel ingests around 100 billion log events a day into ClickHouse Cloud and uses it for customer-facing observability (video).
- ClickHouse's own internal logging platform, LogHouse, passed 100 PB uncompressed and nearly 500 trillion rows in 2025 (ClickHouse blog).
On top of that, ClickHouse now ships a whole observability stack around the engine (ClickStack), PromQL support, and as of 26.10 even a LogsQL dialect. StarRocks can store logs perfectly well (Duplicate Key tables, NGram and inverted indexes), but its full-text index is still Beta and the ecosystem is much thinner for this use case.
Verdict: ClickHouse, clearly.
W2. Product analytics on clickstream → ClickHouse (StarRocks is fine too)
Funnels, retention, path analysis and session metrics on one big event table.
-- How far do users get in the checkout funnel within 1 hour?
SELECT level, count() AS users
FROM
(
    SELECT
        user_id,
        windowFunnel(3600)(
            event_time,
            event_type = 'product_view',
            event_type = 'add_to_cart',
            event_type = 'checkout_start',
            event_type = 'purchase'
        ) AS level
    FROM events
    WHERE event_date BETWEEN '2026-10-01' AND '2026-10-31'
    GROUP BY user_id
)
GROUP BY level
ORDER BY level;
Dummy result (October, 3.1M active users):
| Funnel step reached | Users | Conversion from previous |
|---|---|---|
| 1. Product view | 3,100,000 | – |
| 2. Add to cart | 620,000 | 20.0% |
| 3. Checkout start | 248,000 | 40.0% |
| 4. Purchase | 161,200 | 65.0% |
StarRocks has an equivalent window_funnel() function and handles this workload well, especially if the events must be joined with user or product dimensions at query time. ClickHouse wins on the breadth of built-in analytics functions (windowFunnel, retention, sequenceMatch, uniqCombined, -If/-State combinators, arrays and LIMIT BY) and on raw scan speed for a single wide table.
Verdict: ClickHouse, unless the funnel queries constantly join several normalized tables, in which case StarRocks is a strong option.
W3. Customer-facing seller dashboards → it depends on where the data comes from
This is the workload where most "which one?" debates happen, and the honest answer is: both can do it, they just ask different things of you.
Each of Tulipa's 12,000 sellers opens a dashboard with revenue, orders, returns and top products. That's high QPS, strict tenant isolation, sub-second p95.
The ClickHouse way: model it, then cache it. Tenant first in the sort key, an incremental materialized view for the aggregates, and the query cache for repeated dashboards:
CREATE TABLE seller_daily
(
    seller_id  UInt32,
    day        Date,
    orders     AggregateFunction(count),
    revenue    AggregateFunction(sum, Decimal(18, 2)),
    buyers     AggregateFunction(uniq, UInt64)
)
ENGINE = AggregatingMergeTree
ORDER BY (seller_id, day);

CREATE MATERIALIZED VIEW seller_daily_mv TO seller_daily AS
SELECT seller_id, toDate(created_at) AS day,
       countState() AS orders, sumState(amount) AS revenue, uniqState(buyer_id) AS buyers
FROM order_events
GROUP BY seller_id, day;
ClickHouse 26.10 made this pattern noticeably easier: the query condition cache now handles now() and today() filters by snapping them to a time grid, the query result cache can live on disk and survive restarts, and workload scheduling gained short-queries-first policies (26.10 release webinar).
The StarRocks way: keep the base tables, let the optimizer find the MV. An asynchronous materialized view with transparent query rewrite means the dashboard can keep querying the base tables:
CREATE MATERIALIZED VIEW mv_seller_daily
REFRESH ASYNC EVERY (INTERVAL 1 MINUTE)
AS
SELECT
    o.seller_id,
    date_trunc('day', o.created_at) AS day,
    count(*)                        AS orders,
    sum(o.amount)                   AS revenue,
    count(DISTINCT o.buyer_id)      AS buyers
FROM orders o
GROUP BY o.seller_id, date_trunc('day', o.created_at);
Then add a resource group so dashboards can't be starved by analysts:
CREATE RESOURCE GROUP seller_dashboards
TO (user = 'dashboard_api')
WITH (
    "cpu_weight"         = "16",
    "mem_limit"          = "40%",
    "concurrency_limit"  = "300",
    "type"               = "normal"
);
So which one? The tie-breaker for W3 is usually W4. If the orders behind the dashboard are mutable (refunds, cancellations, status changes), the dashboard has to reflect them correctly and quickly. That pushes towards StarRocks' Primary Key table. If the dashboard is built on append-only events, ClickHouse with good modeling is excellent, and plenty of customer-facing products run on it.
Verdict: Either. Follow the data source.
W4. Orders and payments fed by CDC → StarRocks
Tulipa's orders live in PostgreSQL. Flink streams every change into the analytics layer: 4M new orders a day, each updated about five times. That's ~20M row changes per day, around 230 per second on average and 3,000 per second at peak.
StarRocks' Primary Key table was built for exactly this. Updates become Delete+Insert with an in-memory (or persistent) primary key index, so reads never merge versions:
CREATE TABLE orders
(
    order_id     BIGINT        NOT NULL,
    seller_id    INT           NOT NULL,
    buyer_id     BIGINT        NOT NULL,
    status       VARCHAR(16),
    amount       DECIMAL(18, 2),
    created_at   DATETIME,
    updated_at   DATETIME
)
PRIMARY KEY (order_id)
DISTRIBUTED BY HASH (order_id)
ORDER BY (seller_id, created_at)
PROPERTIES ("enable_persistent_index" = "true");

-- A refund arrives: a normal SQL UPDATE on a Primary Key table
UPDATE orders SET status = 'refunded', updated_at = now() WHERE order_id = 918273645;
Partial column updates (for example, a payments stream that only writes amount and status, and a logistics stream that only writes shipping columns) are supported natively through Stream Load, Routine Load and the Flink connector.
The ClickHouse way is insert-based:
CREATE TABLE orders
(
    order_id    UInt64,
    seller_id   UInt32,
    buyer_id    UInt64,
    status      LowCardinality(String),
    amount      Decimal(18, 2),
    created_at  DateTime,
    updated_at  DateTime64(3)
)
ENGINE = ReplacingMergeTree(updated_at)
ORDER BY (seller_id, order_id);

-- Correct results before merges need FINAL (or argMax-style queries)
SELECT status, sum(amount)
FROM orders FINAL
WHERE seller_id = 4711
GROUP BY status;
This works, and FINAL has become much cheaper over the years. ClickHouse also supports standard SQL UPDATE through patch parts since 25.7, but the docs still mark lightweight updates as beta and aim them at updating a modest share of a table. For a table where every row changes several times, the StarRocks model is still the more natural fit.
Real-world reference point: ZhongAn, a Chinese insurer, reported 3–10× faster queries on StarRocks' Primary Key model than on ClickHouse's ReplacingMergeTree for their real-time workload, while batch write throughput was 20–30% lower than ClickHouse (case study write-up). Two caveats: that test used StarRocks 2.1 and ClickHouse 21.9, both very old, and it shows the trade-off nicely: faster correct reads, slower bulk writes.
Verdict: StarRocks.
W5. Finance BI on a star schema → StarRocks
One 6B-row fact_sales table, nine dimensions, 40 analysts using a BI tool that generates SQL with 5–8 joins. Nobody is going to hand-tune these queries.
StarRocks handles this with its cost-based optimizer and distributed join strategies. If the fact table and the largest dimension are bucketed the same way, a colocate join moves no data at all:
CREATE TABLE fact_sales
(
    sale_date    DATE,
    customer_id  BIGINT,
    product_id   BIGINT,
    store_id     INT,
    quantity     INT,
    amount       DECIMAL(18, 2)
)
DUPLICATE KEY (sale_date, customer_id)
PARTITION BY date_trunc('month', sale_date)
DISTRIBUTED BY HASH (customer_id) BUCKETS 64
PROPERTIES ("colocate_with" = "sales_cg");

CREATE TABLE dim_customer
(
    customer_id  BIGINT,
    segment      VARCHAR(32),
    country      VARCHAR(8),
    signup_date  DATE
)
PRIMARY KEY (customer_id)
DISTRIBUTED BY HASH (customer_id) BUCKETS 64
PROPERTIES ("colocate_with" = "sales_cg");
Smaller dimensions get broadcast automatically, and runtime filters built from the filtered dimensions prune the fact table scan (we covered that mechanism in Part 2 of our Bloom filter series).
ClickHouse has improved dramatically here: statistics-based join reordering on by default since 25.12, runtime filters since 26.2, and in 26.10 parallel merge joins, JOIN ON with any condition and LATERAL JOIN. On a single large server or in ClickHouse Cloud, a star schema works well. The classic ClickHouse pattern, dictionaries for dimensions, is still very effective:
CREATE DICTIONARY dim_customer_dict
(
    customer_id UInt64,
    segment     String,
    country     String
)
PRIMARY KEY customer_id
SOURCE(CLICKHOUSE(TABLE 'dim_customer'))
LAYOUT(HASHED())
LIFETIME(MIN 300 MAX 600);

SELECT
    dictGet('dim_customer_dict', 'segment', customer_id) AS segment,
    sum(amount) AS revenue
FROM fact_sales
WHERE sale_date >= '2026-10-01'
GROUP BY segment;
The remaining gap is distributed joins across a self-managed multi-node cluster, and BI tools that generate whatever SQL they like. That's where StarRocks' MPP shuffle, bucket-shuffle and colocate joins are still more predictable.
Real-world reference point: NAVER reported that in their evaluation all join queries completed on StarRocks while ClickHouse failed four out of five (case study write-up). Treat that as a historical data point: it predates ClickHouse's 2025–2026 join work entirely, and it's exactly the kind of result you should re-test on current versions.
Verdict: StarRocks on a multi-node cluster; close to a tie on a single big node with a recent ClickHouse.
W6. Lake acceleration on Iceberg → StarRocks
Tulipa's data platform team owns 1.2 PB in Iceberg. They want one engine that can query it fast, write back to it, compact it and respect catalog-level permissions.
-- StarRocks: mount the Iceberg REST catalog and query it like native tables
CREATE EXTERNAL CATALOG lake
PROPERTIES (
    "type"                 = "iceberg",
    "iceberg.catalog.type" = "rest",
    "iceberg.catalog.uri"  = "https://iceberg-catalog.tulipa.internal"
);

SELECT c.country, sum(o.amount)
FROM lake.sales.orders o
JOIN lake.sales.customers c ON o.customer_id = c.customer_id
WHERE o.order_date >= '2026-10-01'
GROUP BY c.country;
StarRocks 4.0 made Iceberg close to a native format (hidden partitions, native writes, a compaction procedure, catalog-centric access control), and 4.1 added distributed SQL DELETE on Iceberg tables. Async materialized views over lake tables, with automatic query rewrite, are the usual way to make BI on the lake feel like a warehouse.
ClickHouse reads (and increasingly writes) Iceberg, Delta and Hudi, and 26.10 added Iceberg v3 deletion vectors and Unity Catalog v2. It's very good at ad hoc queries over the lake and at ingesting lake data into MergeTree for hot analytics. StarRocks goes further in maintaining and governing the lake itself.
Verdict: StarRocks if the lake is the system of record; either if the lake is mostly a source.
3. A weighted scorecard (and why weights matter more than scores)
Feature tables don't make decisions. Weights do. Here's a simple scorecard you can copy. Scores are on a 1–5 scale and reflect our view of the current versions; weights reflect what a specific workload needs.
Tulipa's "commerce analytics" platform (W3 + W4 + W5)
| Criterion | Weight | ClickHouse | StarRocks | CH weighted | SR weighted |
|---|---|---|---|---|---|
| Multi-table joins | 25 | 3 | 5 | 75 | 125 |
| Updates / CDC | 20 | 3 | 5 | 60 | 100 |
| Raw scan speed, wide tables | 15 | 5 | 4 | 75 | 60 |
| Concurrency controls out of the box | 15 | 3 | 4 | 45 | 60 |
| Operational simplicity for this team | 10 | 4 | 3 | 40 | 30 |
| Ecosystem and tooling | 10 | 5 | 3 | 50 | 30 |
| Lakehouse integration | 5 | 3 | 5 | 15 | 25 |
| Total (out of 500) | 100 | 360 (72%) | 430 (86%) |
Tulipa's observability platform (W1 + W2)
Same engine scores, different weights:
| Criterion | Weight | ClickHouse | StarRocks | CH weighted | SR weighted |
|---|---|---|---|---|---|
| Raw scan speed, wide tables | 30 | 5 | 4 | 150 | 120 |
| Ingestion rate and compression | 25 | 5 | 4 | 125 | 100 |
| Text search | 15 | 5 | 3 | 75 | 45 |
| Ecosystem and tooling | 15 | 5 | 3 | 75 | 45 |
| Multi-table joins | 5 | 3 | 5 | 15 | 25 |
| Updates / CDC | 5 | 3 | 5 | 15 | 25 |
| Operational simplicity for this team | 5 | 4 | 3 | 20 | 15 |
| Total (out of 500) | 100 | 475 (95%) | 375 (75%) |
The engines didn't change between the two tables. The workload did. That's the whole point of this post: if someone tells you one engine is "better" without asking about your workload, they're telling you about their weights.
Make your own copy: list 6–8 criteria, agree on weights with the people who'll live with the system before anyone runs a benchmark, then fill in the scores from your bake-off (section 6), not from blog posts. Including this one.
4. What real migrations tell you (in both directions)
Migration stories are useful, as long as you read them for the reason people moved, not the headline speedup.
| Company | Direction / choice | Main reason | Caveat |
|---|---|---|---|
| OpenAI | ClickHouse for observability | Petabytes of logs per day, ingestion spikes, low-latency search | Vendor blog; append-only workload |
| Twilio | ClickHouse Cloud for logs | ~30M lines/s peak, PB/day, 50% yearly growth | Managed service; append-only workload |
| Character.AI | ClickHouse (ClickStack) | 10× more logs at roughly half the cost | Vendor user story |
| DeWu | ClickHouse → StarRocks (shared-data) | Vertical scaling ceiling, week-long resharding, a hot-data standby cluster adding >50% cost; reported ~40% cost cut and roughly halved latency | Large multi-node cluster; self-managed |
| Trip.com (UBT) | ClickHouse → StarRocks (shared-data) | Scaling required costly data movement; elastic scaling without migration | Self-managed, storage/compute separation |
| ZhongAn | ClickHouse → StarRocks | Joins and concurrency; PK table 3–10× faster than ReplacingMergeTree | 2021-era versions; batch writes slower on StarRocks |
Read the pattern, not the logos:
- Teams that chose ClickHouse mostly had append-only, high-volume data and wanted maximum ingestion and scan efficiency.
- Teams that moved to StarRocks mostly hit operational scaling pain on self-managed ClickHouse clusters (resharding, rebalancing), mutable data, or join-heavy BI.
- Many StarRocks migration stories predate ClickHouse's join optimizer, runtime filters and lightweight updates. Some of their pain points would look different on ClickHouse 26.x, and on ClickHouse Cloud, resharding isn't your problem at all.
One more practical detail if you're considering a ClickHouse → StarRocks move: SQL dialects differ more than people expect (double-quoted identifiers, scoped aliases, ARRAY JOIN, function names). StarRocks maintains an open-source ClickHouse SQL rewriter to help translate queries, and DeWu reported using a dialect-mapping layer for common ClickHouse functions during their migration. Budget real time for query migration anyway.
5. One engine or two?
Looking at Tulipa's fingerprint, the "correct" answer is two engines: ClickHouse for W1 and W2, StarRocks for W4, W5 and W6, with W3 following W4. Plenty of companies run exactly that.
But two engines also mean two sets of skills, two upgrade cycles, two monitoring setups and two on-call runbooks. For a small team, that's a real cost.
| Option | When it makes sense | What you accept |
|---|---|---|
| ClickHouse only | Observability and event analytics dominate; joins are moderate; you can denormalize or use dictionaries; ClickHouse Cloud is an option | More modeling work for CDC and star-schema BI; FINAL or patch-part discipline for mutable data |
| StarRocks only | BI, CDC and the lake dominate; logs are modest or live in a dedicated observability tool | Weaker text search and observability ecosystem; larger storage footprint for logs |
| Both | Each side is big enough to justify its own platform, and you have (or can buy) the skills | Two platforms to operate; a clear rule for which data goes where |
A simple rule of thumb we use with clients:
Is any single workload big enough to need a dedicated platform team?
│
├── No  → Pick ONE engine, based on your HEAVIEST workload's fingerprint.
│         Accept extra modeling effort for the others.
│
└── Yes → Is the second-largest workload a poor fit for that engine?
          │
          ├── No  → Still one engine.
          └── Yes → Two engines, with a written rule:
                    "append-only machine data → ClickHouse,
                     mutable business data and the lake → StarRocks"
For Tulipa, logs (W1) alone justify a platform, and W4/W5 are a poor fit for an append-optimized setup. So two engines it is. A 20-person startup with the same workloads at a tenth of the scale should probably pick one.
6. Run a two-week bake-off
The only benchmark that matters is your queries, on your data, at your concurrency. Here's the plan we use:
| Day | Activity | Output |
|---|---|---|
| 1–2 | Agree on scorecard weights; pick 15–30 representative queries per workload, including the ugly ones | Signed-off scorecard and query set |
| 3–4 | Load 2–4 weeks of production-shaped data into both engines (real cardinalities and skew) | Two comparable datasets |
| 5–6 | Model each engine idiomatically: sort keys, MVs, dictionaries in ClickHouse; table types, bucketing, async MVs in StarRocks | No "naive port" penalty for either side |
| 7–8 | Single-query latency, cold and warm cache | p50 / p95 per query |
| 9–10 | Concurrency ramp (8 → 256) with ingestion running | Throughput and p99 at each step; the "knee" |
| 11 | Failure tests: kill a node, run an update storm, run a heavy export next to dashboards | Behavior under stress |
| 12 | Ops review: upgrade, schema change, scale out, backup/restore | Operational notes |
| 13–14 | Fill in the scorecard, estimate 3-year cost, write the decision | A decision you can defend |
What a results table might look like at the end (dummy numbers, for illustration only):
| Query (W3/W5 set) | ClickHouse p95 @ 64 conc. | StarRocks p95 @ 64 conc. | Notes |
|---|---|---|---|
| Seller revenue, last 30 days (MV) | 38 ms | 45 ms | Both hit pre-aggregates |
| Seller top products (1 join) | 120 ms | 95 ms | |
| Refund rate with fresh updates | 410 ms (FINAL) | 85 ms | PK table avoids merge-on-read |
| Finance: 7-table star join, 1 month | 2.9 s | 1.1 s | Shuffle + colocate on StarRocks |
| Error spike by service, 30 min | 60 ms | 240 ms | Text index + sort key on ClickHouse |
| Full-month export, 50M rows | 14 s | 17 s | Scan-bound on both |
Notice that even in the dummy table, neither engine wins every row. That's what real bake-offs usually look like, and it's why the scorecard weights have to be agreed before the numbers come in.
Three things that ruin bake-offs:
- Porting one engine's schema to the other. A ClickHouse schema copied into StarRocks (or vice versa) measures the port, not the engine.
- Testing without ingestion. Merges and compactions are part of the workload.
- Testing one query at a time when your real problem is 300 concurrent dashboards.
7. Quick-reference decision table
| If your workload is mostly… | Lean toward | Watch out for |
|---|---|---|
| Logs, traces, metrics, security events | ClickHouse | Many tiny inserts; plan batching or async inserts |
| Clickstream and product analytics on one wide table | ClickHouse | Joins with large, frequently changing dimensions |
| Customer-facing dashboards on append-only events | ClickHouse (with MVs and caching) | Concurrency needs explicit workload configuration |
| Customer-facing dashboards on mutable business data | StarRocks | Primary key index memory; use the persistent index |
| CDC from PostgreSQL/MySQL with frequent updates | StarRocks | Batch write throughput vs append-only engines |
| BI-tool-generated star/snowflake joins on a cluster | StarRocks | Bucket counts and colocation design up front |
| Iceberg as system of record | StarRocks | Catalog and credential setup; compaction ownership |
| Small team, one server, fast time to value | ClickHouse | Planning for scale-out later (or use ClickHouse Cloud) |
| Self-managed, elastic, object-storage-backed cluster | StarRocks (shared-data) | Cache sizing on compute nodes |
TL;DR
- Start from the workload, not the engine. Fingerprint it on data shape, mutability, query shape, concurrency, freshness, data location and team.
- ClickHouse fits append-only, high-volume, scan-heavy work: observability, events, product analytics, and dashboards on top of them. 26.10 widened its lead there with better caching and leaner hash tables.
- StarRocks fits mutable, normalized, join-heavy work: CDC-fed facts, BI-tool star schemas on a cluster, and Iceberg as the system of record.
- Customer-facing dashboards can go either way. Let the source data decide: append-only events → ClickHouse is excellent; mutable business data → StarRocks is simpler.
- Weights decide more than scores. The same engine scores produce opposite winners for different workloads.
- Read migration stories for their reasons, and check which versions they used.
- One engine or two depends on whether your second-largest workload justifies its own platform.
- Run a two-week bake-off with idiomatic schemas, ingestion running and real concurrency.
How BlancoByte can help
At BlancoByte we work with both ClickHouse and StarRocks in production, so we don't have a horse in this race. We can help you:
- Fingerprint your workloads and build a scorecard your team agrees on before any benchmark runs.
- Run the bake-off: idiomatic schemas for both engines, production-shaped data, concurrency tests with ingestion running, and a written recommendation.
- Design the platform you choose, self-managed or managed, including the "both engines" setup with clear data ownership rules.
- Migrate between engines (in either direction), including SQL translation, dual-run validation and cutover.
- Support you in production, from tuning to upgrades.
If you're weighing StarRocks against ClickHouse for a real workload, get in touch. We're happy to start with a free review of your use case.
References
ClickHouse
- ClickHouse v26.10 release webinar
- ClickHouse changelog
- Why OpenAI chose ClickHouse for petabyte-scale observability
- How Twilio handles a petabyte of logs a day with ClickHouse Cloud
- Observability for the age of agents: how Vercel uses ClickHouse
- Scaling our observability platform beyond 100 petabytes (LogHouse)
- ClickHouse user stories
- ClickHouse docs: Workload scheduling
- ClickHouse docs: Query cache
- ClickHouse docs: Alternative query languages
StarRocks
- StarRocks 4.0 is now available
- StarRocks 4.1 is now available
- StarRocks 4.1 release notes
- StarRocks 2025 year in review
- StarRocks docs: Primary Key table
- StarRocks SQLTransformer (ClickHouse SQL rewriter)
Migration case studies (read with the version and vendor caveats in mind)
- DeWu: ClickHouse to StarRocks migration
- Trip.com: scaling UBT analytics by migrating from ClickHouse to StarRocks
- ZhongAn: StarRocks vs ClickHouse in real-time insurance analytics
- NAVER: migrating from ClickHouse to StarRocks
From this blog