Performance Tuning ClickHouse for High-Concurrency Workloads
It's 9:00 on a Monday. Your customer-facing analytics product has been fine all weekend, with p95 latency around 80 ms. Then the European office hours start, a few thousand users open their dashboards at once, every dashboard fires 15 queries, and p99 climbs to 4 seconds. Some requests fail with TOO_MANY_SIMULTANEOUS_QUERIES. Nothing is broken. ClickHouse is just doing exactly what it was configured to do.
In our StarRocks vs ClickHouse comparison we wrote that ClickHouse can serve high-QPS workloads, but relies more on data modeling and explicit workload configuration than StarRocks does out of the box. This post is the "how" behind that sentence.
ClickHouse is built to throw all cores at one query. That's why a single query is so fast. Under high concurrency, the same default means queries compete for the same CPU, memory and I/O. Tuning for concurrency is mostly about three things:
- Making each query cheaper, so there's less work to share.
- Controlling how resources are shared: per-query parallelism, CPU slots, memory and admission.
- Adding capacity in the right place, when the first two aren't enough.
We'll go through them in that order, because that's also the order of impact.
Versions covered: the settings in this post apply to ClickHouse 26.x (26.9 at the time of writing). Most of them exist in 25.x as well. Check
system.settingsandsystem.server_settingson your own version before copying anything.
At a glance
| Lever | What it controls | Where you set it | Impact |
|---|---|---|---|
ORDER BY, projections, MVs, dictionaries | How much data each query reads | Schema | ⭐⭐⭐⭐⭐ |
| Query condition cache | Skipping granules a repeated filter already ruled out | Session setting | ⭐⭐⭐ |
| Query cache | Reusing full results of identical queries | Query / profile setting | ⭐⭐⭐⭐ (when it hits) |
max_threads | Parallelism of one query | Profile / query | ⭐⭐⭐⭐ |
Concurrency control (concurrent_threads_soft_limit_*) | Total query threads across all queries | Server config | ⭐⭐⭐ |
Admission limits (max_concurrent_queries*) | How many queries run at once | Server / user | ⭐⭐⭐ (protection) |
Workload scheduling (CREATE WORKLOAD) | CPU, I/O and query slots between workloads | SQL DDL | ⭐⭐⭐⭐ |
| Memory limits | Per query, per user, per server | Profile / server | ⭐⭐⭐ (protection) |
Insert batching / async_insert | Part count and merge pressure | Client / user | ⭐⭐⭐⭐ |
| Replicas and routing | Total read capacity | Topology | ⭐⭐⭐⭐⭐ |
1. Start with numbers, not settings
"We have 5,000 users" doesn't tell you anything about database load. What matters is how many queries run at the same time, and how expensive they are.
Translate your traffic into database terms first:
- Peak requests per second sent to ClickHouse
- Queries per dashboard load (fan-out)
- Query mix: selective lookups, aggregations, joins, exports
- p50 / p95 / p99 targets per query class
- Insert rate and batch size
Then use Little's Law to get the number that actually matters:
concurrent queries ≈ QPS × average execution time
At 1,000 QPS and 50 ms average execution time, about 50 queries are running at any moment. At the same QPS with 500 ms queries, it's 500. That's why making queries faster is also the most effective concurrency fix: a query that finishes 10× faster takes up a tenth of the "seats".
To see where you are today, group your recent queries by shape:
SELECT
    normalized_query_hash,
    any(query)                           AS example,
    count()                              AS executions,
    quantile(0.50)(query_duration_ms)    AS p50_ms,
    quantile(0.99)(query_duration_ms)    AS p99_ms,
    formatReadableSize(max(memory_usage)) AS max_memory,
    max(peak_threads_usage)              AS max_threads_used,
    formatReadableQuantity(avg(read_rows)) AS avg_rows_read
FROM system.query_log
WHERE type = 'QueryFinish'
  AND is_initial_query = 1
  AND event_time >= now() - INTERVAL 1 HOUR
GROUP BY normalized_query_hash
ORDER BY executions * p50_ms DESC
LIMIT 20;
Sorting by executions × p50_ms shows which query shapes consume the most total time. Those are your tuning targets, often before you touch a single server setting.
On a cluster or in ClickHouse Cloud,
system.query_logis local to each server. UseclusterAllReplicas('default', merge('system', '^query_log'))to see all of them.
2. Make each query cheaper (the biggest lever)
No concurrency setting can compensate for a dashboard query that reads 2 billion rows. Before anything else, reduce the work per query.
Design ORDER BY around your filters
The sort key decides how much data the sparse primary index can skip. For a multi-tenant product, the tenant is almost always the first column:
CREATE TABLE events
(
    tenant_id   UInt32,
    event_time  DateTime,
    event_type  LowCardinality(String),
    user_id     UInt64,
    revenue     Decimal(18, 2)
)
ENGINE = MergeTree
PARTITION BY toYYYYMM(event_time)
ORDER BY (tenant_id, event_type, event_time);
A dashboard query for one tenant now reads only that tenant's granules, no matter how many tenants share the table. Check it with EXPLAIN indexes = 1, the same way we did for Bloom filters in Part 1 of the Bloom filter series.
Pre-aggregate what dashboards ask for repeatedly
Most dashboard queries aggregate the same dimensions over and over. Do it once, at insert time, with an incremental materialized view:
CREATE TABLE events_hourly
(
    tenant_id   UInt32,
    hour        DateTime,
    event_type  LowCardinality(String),
    events      AggregateFunction(count),
    users       AggregateFunction(uniq, UInt64),
    revenue     AggregateFunction(sum, Decimal(18, 2))
)
ENGINE = AggregatingMergeTree
ORDER BY (tenant_id, event_type, hour);

CREATE MATERIALIZED VIEW events_hourly_mv TO events_hourly AS
SELECT
    tenant_id,
    toStartOfHour(event_time) AS hour,
    event_type,
    countState()      AS events,
    uniqState(user_id) AS users,
    sumState(revenue) AS revenue
FROM events
GROUP BY tenant_id, hour, event_type;
The dashboard then queries events_hourly with countMerge, uniqMerge and sumMerge. A query that scanned millions of raw rows now reads a few thousand pre-aggregated ones. This is usually the single largest win for user-facing analytics.
Use projections for a second access pattern
If some queries filter by user_id instead of event_type, a projection stores a second sort order inside the same table, and the optimizer picks it automatically:
ALTER TABLE events ADD PROJECTION by_user
(
    SELECT * ORDER BY (tenant_id, user_id, event_time)
);
ALTER TABLE events MATERIALIZE PROJECTION by_user;
Projections cost storage and insert time, so add them for access patterns that justify it, not "just in case".
The small things that add up
- Select only the columns you need.
SELECT *on a wide table multiplies I/O and memory by the number of columns. - Return only what the UI shows. Push
LIMITand aggregation into ClickHouse instead of fetching 100,000 rows to render a chart with 50 points. - Use dictionaries for dimension lookups instead of joining a dimension table on every query.
- Avoid
FINALon hot paths. If you useReplacingMergeTree, considerargMax-style queries or pre-aggregated tables for the dashboard. - Add skip indexes where the data allows it. A Bloom filter on a rare, clustered ID turns a full scan into a handful of granules (see our Bloom filter series).
3. Let the caches do the repetitive work
User-facing analytics is repetitive by nature: the same dashboards, the same filters, mostly the same data. ClickHouse has two caches that exploit this in different ways.
The query condition cache
The query condition cache remembers, for each filter condition and each granule, whether no row in that granule matched. It stores a single bit per filter and granule, so it uses very little memory (100 MB maximum by default, set with query_condition_cache_size). The next time the same filter runs, ClickHouse skips granules it already knows are empty, even if new data was inserted since, because existing parts are immutable.
It works best when:
- the same filter conditions are repeated,
- most of the data doesn't change between queries,
- and the filter is selective.
That describes most dashboards. It's controlled by use_query_condition_cache, and you can check hits and misses in system.events (QueryConditionCacheHits, QueryConditionCacheMisses). It's lost on restart, so expect a warm-up period after deployments.
The query cache
The query cache stores full results of SELECT queries. A cache hit returns immediately without reading any table data. It's opt-in:
SELECT
    event_type,
    countMerge(events) AS events
FROM events_hourly
WHERE tenant_id = {tenant:UInt32}
  AND hour >= {window_start:DateTime}
  AND hour <  {window_end:DateTime}
GROUP BY event_type
SETTINGS
    use_query_cache = true,
    query_cache_ttl = 30;
Things to know before you rely on it:
| Behavior | What it means for you |
|---|---|
Results are stale up to query_cache_ttl (default 60 s) | Only use it where slightly old data is acceptable |
Queries with now(), today(), rand() aren't cached by default | Pass explicit time boundaries from the application, rounded to a bucket (e.g. the current minute), so identical dashboards produce identical queries |
| One cache per server process | Hit rates drop if traffic is spread randomly across many replicas; sticky routing per tenant helps |
| Not shared between users by default | Sharing is possible but not recommended for security reasons |
query_cache_min_query_runs, query_cache_min_query_duration | Only cache queries that are repeated, or expensive enough to be worth it |
The rounding trick is the important one. WHERE event_time >= now() - INTERVAL 24 HOUR never hits the cache. WHERE hour >= '2026-11-02 09:00:00', computed by the application and rounded to the minute, hits it for every user who opens the same dashboard in that minute.
One warning: size your cluster for the uncached workload. After a restart, a deployment or a change in query shape, the hit rate can drop to zero instantly. The cache should make the system faster, not be the only thing keeping it alive.
4. Control per-query parallelism
By default, max_threads equals the number of CPU cores visible to ClickHouse. One heavy query can therefore use the whole server. That's great for a lone analyst and bad for 500 concurrent dashboard users.
Set max_threads per workload, from measurements
Lowering max_threads for the dashboard user means each query takes a smaller share, so more queries progress at the same time. It can also make large scans slower. There's no universal value: ClickHouse's own sizing guide explicitly advises against a blanket max_threads = 1 or 2 for dashboards.
Test 1, 2, 4, 8 and the default against your real query mix, and pick the value that meets your p99 at your target QPS. Then put it in a settings profile:
CREATE SETTINGS PROFILE dashboard_profile SETTINGS
    max_threads        = 4,
    max_memory_usage   = 4000000000,   -- 4 GB per query
    max_execution_time = 10,
    max_result_rows    = 100000,
    result_overflow_mode = 'break';

CREATE SETTINGS PROFILE batch_profile SETTINGS
    max_threads        = 16,
    max_memory_usage   = 40000000000,
    max_execution_time = 3600;

ALTER USER dashboard_api SETTINGS PROFILE 'dashboard_profile';
ALTER USER etl           SETTINGS PROFILE 'batch_profile';
max_threads is an upper bound, not a reservation. A selective query that only reads a few granules won't use 4 threads anyway.
max_execution_timeis a useful guardrail but not a substitute for a client-side deadline. ClickHouse only starts estimating execution time aftertimeout_before_checking_execution_speed(10 s by default), and enforcement happens at specific points in the pipeline. Enforce the user-facing timeout in your application and cancel the query when it expires.
Cap total threads with concurrency control
max_threads limits one query. Concurrency control limits the total number of query-processing threads across all queries on a server, using CPU "slots":
<clickhouse>
    <!-- Effective soft limit = 2 × CPU cores (this is the default ratio) -->
    <concurrent_threads_soft_limit_ratio_to_cores>2</concurrent_threads_soft_limit_ratio_to_cores>

    <!-- How free slots are handed out under contention -->
    <concurrent_threads_scheduler>max_min_fair</concurrent_threads_scheduler>
</clickhouse>
How it works:
- Every query always gets at least one thread, so nothing is starved completely. The limit is soft.
- When slots free up, queries can scale up to their
max_threadswhile running. - With
concurrent_threads_lazy_allocation(on by default), a query starts with one slot and only asks for more when its pipeline actually has parallel work. This avoids queries reserving slots they never use.
The scheduler policy matters under heavy contention:
| Policy | Behavior | When to use |
|---|---|---|
round_robin | Slots handed out in turn; the first slot of every query is unconditional | Light contention |
fair_round_robin | Like round_robin, but the first thread doesn't need a slot, so max_threads = 1 queries don't eat them all | Mixed max_threads values |
max_min_fair | Freed slots always go to the query with the fewest slots | Heavy oversubscription: many short queries next to a few long ones |
For dashboards next to long-running reports, max_min_fair keeps short queries from being penalized by long queries that accumulated slots over time. The scheduler can be changed at runtime, without a restart.
If you declare a CPU resource for workload scheduling (section 6), the workload scheduler takes over and
concurrent_threads_soft_limit_*no longer applies.
5. Admission control: decide what happens when you're full
At some point the server is saturated. You can either accept every query and let latency grow for everyone, or turn some away early. ClickHouse gives you several admission limits:
| Setting | Scope | Default (self-managed) |
|---|---|---|
max_concurrent_queries | Server, all queries | 0 (unlimited) |
max_concurrent_select_queries | Server, SELECT only | 0 |
max_concurrent_insert_queries | Server, INSERT only | 0 |
max_concurrent_queries_for_user | Per user | 0 |
max_concurrent_queries_for_all_users | Across users | 0 (1,000 per replica in ClickHouse Cloud) |
There's a common myth that ClickHouse is limited to 100 concurrent queries. It isn't. That was an old default for max_concurrent_queries, and today the server-level default is unlimited. These settings are protection, not capacity.
What happens when a limit is hit:
- For
max_concurrent_queries, a new query can wait up toqueue_max_wait_msfor a slot. The default is0, so it's rejected immediately withTOO_MANY_SIMULTANEOUS_QUERIES. - The select, insert, per-user and all-users limits reject immediately.
Set the limits below the point where your load tests show p99 rising sharply, with headroom for merges and ingestion. A limit of 100 can be far too high for memory-heavy joins and far too low for selective lookups, so don't copy numbers from other people's setups (including this post).
For anything more than a simple cap, use a QUERY resource in workload scheduling, which gives you real queuing per workload. That's the next section.
6. Workload scheduling: isolate dashboards from everything else
The worst concurrency incidents usually aren't caused by dashboards at all. They're caused by one export, one ad hoc analyst query or one backfill landing on the same server at 9:00.
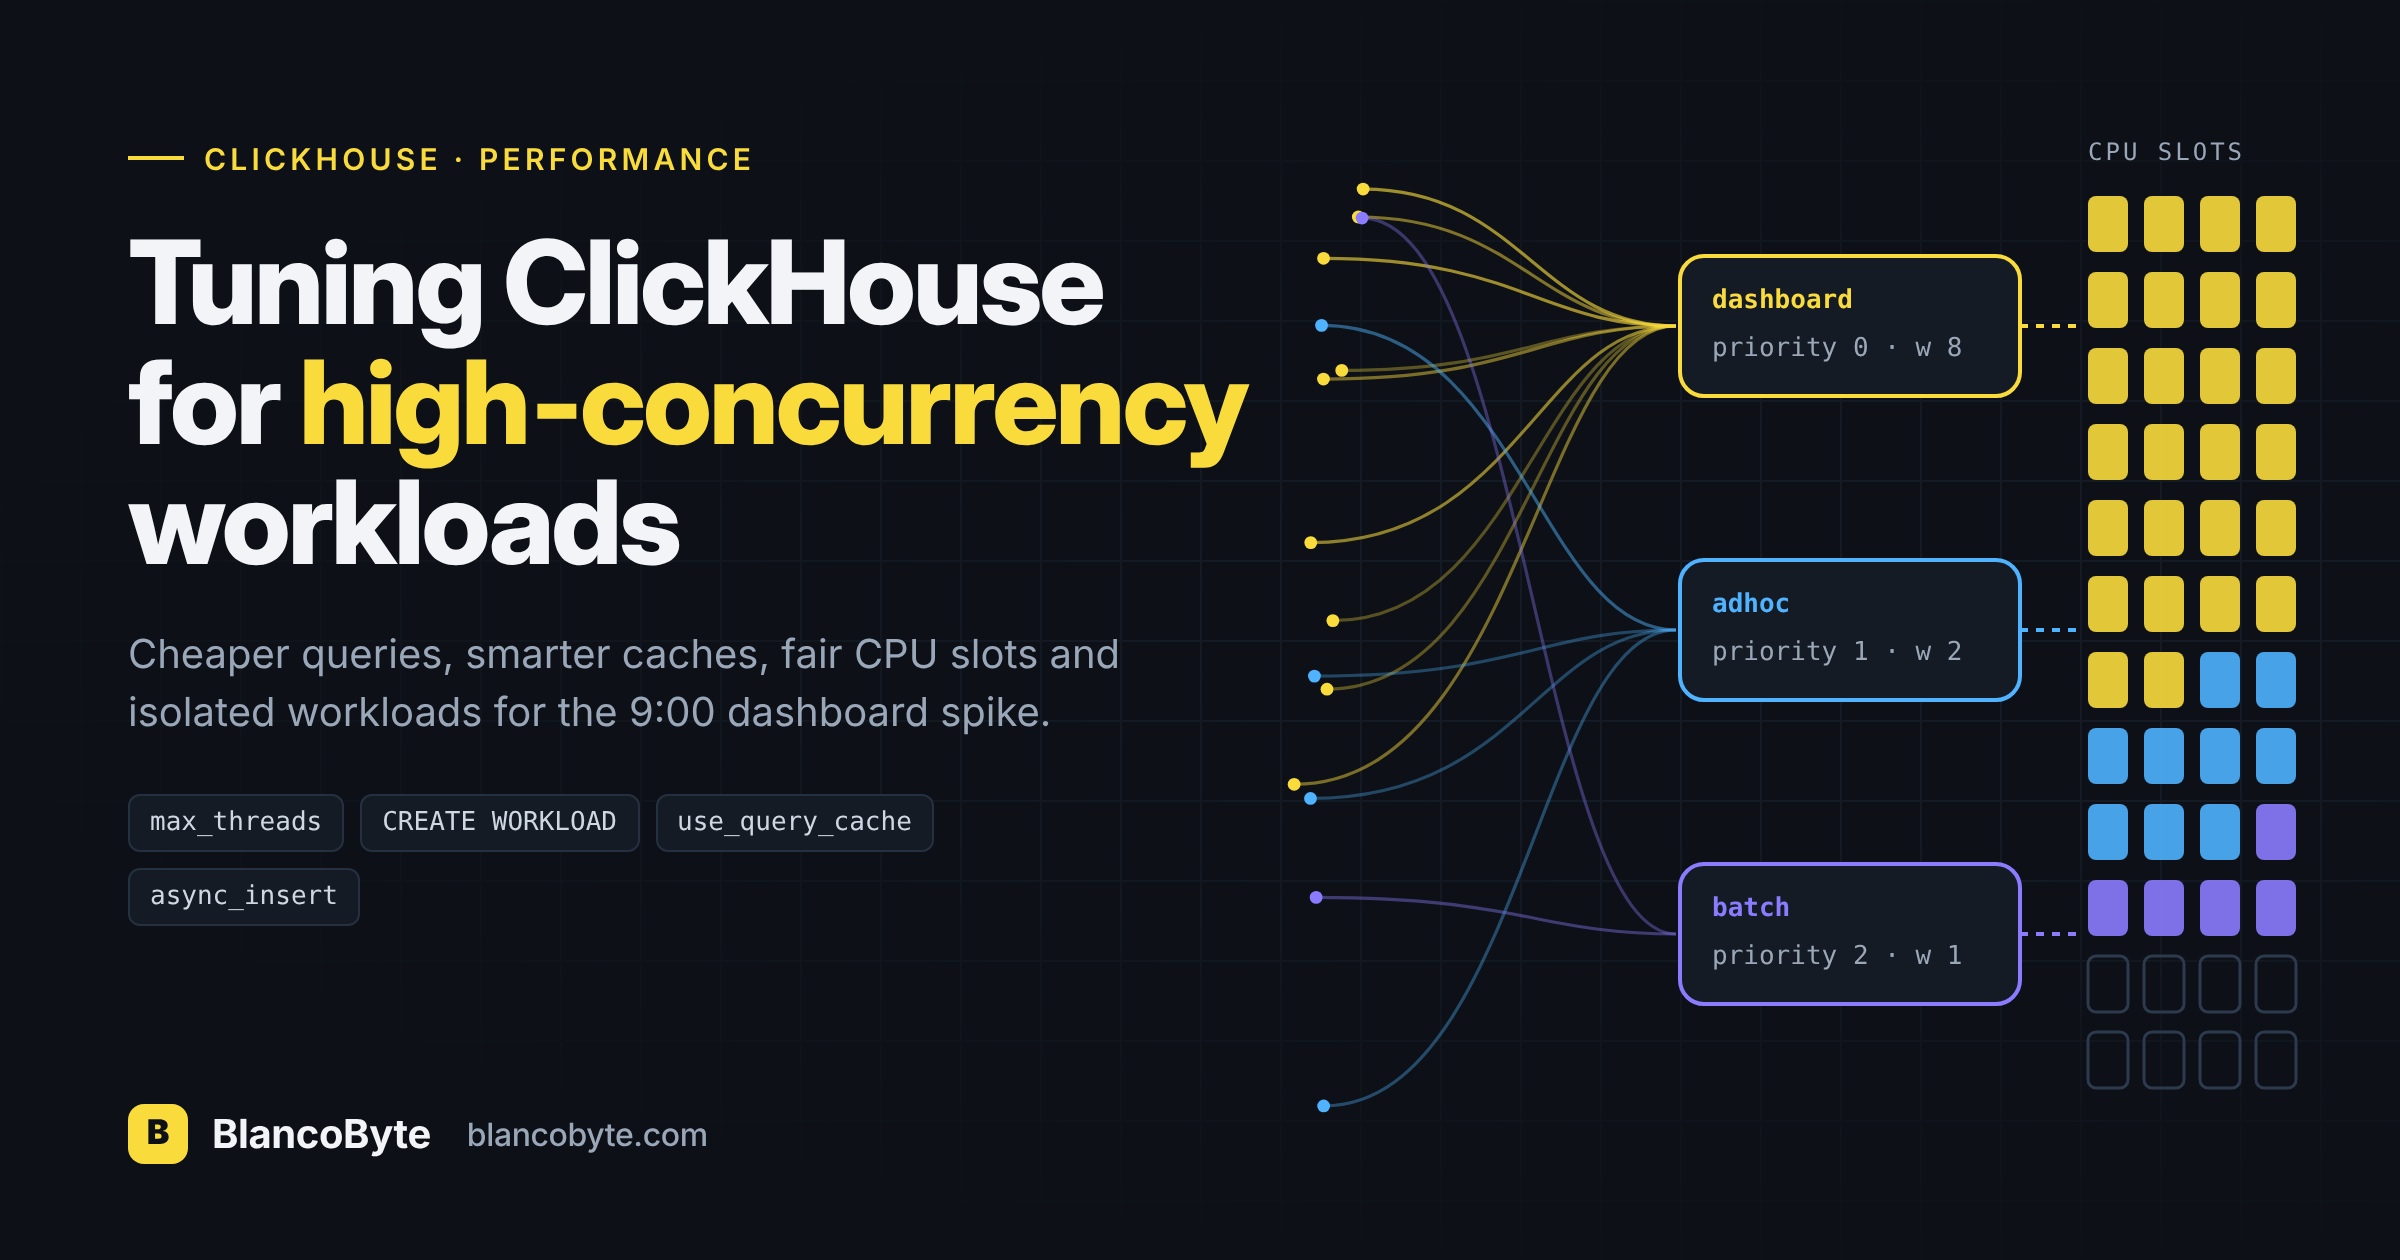
Workload scheduling lets you define named workloads with priorities, weights and limits for CPU, remote disk I/O and query slots, all in SQL:
-- Enable scheduling for CPU and query slots
CREATE RESOURCE cpu   (MASTER THREAD, WORKER THREAD);
CREATE RESOURCE query (QUERY);

-- Root: total thread budget for all queries
CREATE WORKLOAD all SETTINGS max_concurrent_threads_ratio_to_cores = 2;

-- Dashboards: highest priority, bounded concurrency and queue
CREATE WORKLOAD dashboard IN all SETTINGS
    priority = 0,
    weight = 8,
    max_concurrent_queries = 200,
    max_waiting_queries = 500;

-- Ad hoc analysts: lower priority
CREATE WORKLOAD adhoc IN all SETTINGS
    priority = 1,
    weight = 2,
    max_concurrent_queries = 20;

-- ETL, exports, backfills: lowest priority
CREATE WORKLOAD batch IN all SETTINGS
    priority = 2,
    weight = 1,
    max_concurrent_queries = 5;
Then assign queries to workloads through settings profiles:
ALTER SETTINGS PROFILE dashboard_profile SETTINGS workload = 'dashboard';
ALTER SETTINGS PROFILE batch_profile     SETTINGS workload = 'batch';
How to read it:
- Priority decides who goes first under contention (lower number = higher priority).
- Weight decides how capacity is shared between workloads with the same priority.
max_concurrent_querieson a workload queues queries instead of rejecting them. Whenmax_waiting_queriesis reached, ClickHouse returnsSERVER_OVERLOADED.- Throttling with
max_cpus/max_cpu_shareonly takes effect whencpu_slot_preemptionis enabled on the server.
Caveats worth knowing:
- Queued queries have no server-side timeout. Your application must enforce deadlines and cancel.
- Queued queries don't show up in
SHOW PROCESSLISTuntil they start. Monitor queue depth insystem.scheduler(queue_length). - CPU scheduling covers queries, not merges and mutations. Background work still competes. That's why, for the strongest isolation, you still need separate compute (section 9).
- Async inserts and some admin queries like
KILLaren't counted against query slots, which is what you want: you can always kill a runaway query.
7. Memory: protect the server, not just the query
High concurrency turns memory into a sum. Ten queries that each use 3 GB are fine on a 64 GB server. Thirty of them aren't.
| Setting | Limits | Note |
|---|---|---|
max_memory_usage | One query on one server | Set from the measured peak of valid queries, plus headroom |
max_memory_usage_for_user | All queries of one user | The one that actually protects you from a burst of the same dashboard |
max_server_memory_usage / max_server_memory_usage_to_ram_ratio | The whole server | Last line of defense |
Workload max_memory | One workload | With a MEMORY RESERVATION resource |
Two practical tips:
- Watch memory-hungry query shapes: high-cardinality
GROUP BY, large join build sides, bigORDER BYwithoutLIMIT. They usually need their own profile and limits. - Let big operations spill instead of fail where it makes sense:
max_bytes_before_external_group_byandmax_bytes_before_external_sort(and join spilling since 26.4) trade speed for stability. For dashboard queries, failing fast with a clear error is often better than spilling. For batch jobs, spilling is usually the right call.
8. Don't let inserts slow down reads
Ingestion and queries share the same disks and CPUs. The classic way inserts hurt query latency is too many small parts: every synchronous INSERT creates a part, background merges fall behind, and every query has to open and read more parts.
Batch on the client
ClickHouse recommends batches of at least 1,000 rows, ideally 10,000 to 100,000 rows per synchronous insert. Fewer, bigger inserts mean fewer parts and less merge work.
Use async inserts when you can't batch
When many small clients write at once (IoT devices, application servers, many Kafka consumers), let the server do the batching:
ALTER USER ingest_user SETTINGS
    async_insert = 1,
wait_for_async_insert = 1;- With
wait_for_async_insert = 1(the recommended mode), the client gets an acknowledgment only after the buffer is flushed, so errors and backpressure still reach the client. - With
wait_for_async_insert = 0, the client is acknowledged as soon as the data is in memory. Faster, but data can be lost on a crash and flush errors are hidden. - Async insert deduplication is off by default; turn on
async_insert_deduplicateif your producers retry. INSERT INTO ... SELECTis always synchronous.
Check the partition key
Async inserts don't help if your partition key has high cardinality. A single flush still creates one part per partition it touches. PARTITION BY toYYYYMM(...) or toDate(...) is usually right; PARTITION BY tenant_id with thousands of tenants almost never is.
Keep an eye on merges and parts:
SELECT
    database,
    table,
    count()            AS active_parts,
    max(modification_time) AS last_part
FROM system.parts
WHERE active
GROUP BY database, table
ORDER BY active_parts DESC
LIMIT 10;
A steadily growing part count during peak hours is an early warning that queries are about to get slower.
9. Scale out: replicas, routing and separate compute
When a single server can't meet the target after all of the above, add capacity. How you add it matters.
Replicas add read capacity only if traffic reaches them
Replicas store copies of the same data and can serve independent queries. But adding a replica does nothing if all requests still go to the same node. Make sure your load balancer, proxy or client distributes reads across replicas.
A routing tip that combines well with section 3: route by tenant (consistent hashing on tenant_id) instead of random round-robin. Each replica then sees a stable subset of tenants, and the query cache and page cache hit rates go up.
Also remember that every replica in a self-managed cluster still does replication and background merges. Don't size replicas as if 100% of their CPU is available for queries.
Shards vs replicas vs parallel replicas
| What it does | Good for | |
|---|---|---|
| Shards | Split data across servers; one query runs on all of them | Data that doesn't fit, or very large scans |
| Replicas | Full copies; each serves its own queries | Throughput (QPS) |
| Parallel replicas | One query uses several replicas | Lowering latency of heavy queries |
Parallel replicas are tempting, but under high concurrency they're often counterproductive: one query takes capacity from several replicas that could have served other requests, and coordination overhead slows down small queries. For dashboards, load-balancing independent queries across replicas is the main throughput mechanism. Use parallel replicas selectively, for query classes where benchmarks show a win.
Separate compute for the strongest isolation
Workload scheduling shares one server fairly. Separate compute avoids sharing at all.
- Self-managed: put dashboards and ingestion/batch on separate replicas or separate clusters, and route by user.
- ClickHouse Cloud: use warehouses (compute-compute separation). A typical setup is a read-write service for ingestion, a read-only service for dashboards and a third service for exports and analysts. Read-only services don't do background merges, so their CPU stays focused on queries. Vertical autoscaling adjusts service size within the bounds you set; replica counts are changed manually or with scheduled scaling.
10. Load test like production
Every number in the previous sections should come from a test, not a guess. clickhouse-benchmark ships with ClickHouse and is enough for most of it:
# Replay a file of representative dashboard queries at increasing concurrency
for c in 8 16 32 64 128 256; do
  echo "== concurrency $c =="
  clickhouse-benchmark \
      --host ch-replica-1 \
      --user dashboard_api \
      --concurrency $c \
      --iterations 5000 \
      --timelimit 120 \
      < dashboard_queries.sql
done
A test is only useful if it looks like production:
- Use production-scale data: real cardinalities, skew, partition counts and part counts.
- Run ingestion during the test. Reads without merges are a fantasy number.
- Use the real query mix, including the occasional export, not just your fastest query.
- Test cold and warm caches. Restart, then measure the first minutes separately.
- Find the knee: the concurrency where p99 exceeds the target, throughput stops growing, memory errors appear or merges fall behind.
- Repeat with one replica down. Your SLO has to hold during a failure, not only when everything is healthy.
- Set admission limits below the knee, with headroom.
11. Monitor the right signals
Concurrency problems build up gradually and then show up all at once. These are the signals worth alerting on:
| Signal | Where to find it |
|---|---|
| Running queries, memory and threads per query | system.processes |
| Latency per query shape (p50/p95/p99) | system.query_log (see section 1) |
| Queued queries per workload | system.scheduler (queue_length) |
| Rejected queries | system.errors: TOO_MANY_SIMULTANEOUS_QUERIES, SERVER_OVERLOADED, MEMORY_LIMIT_EXCEEDED |
| Cache effectiveness | system.events: QueryCacheHits / QueryCacheMisses, QueryConditionCacheHits / QueryConditionCacheMisses |
| Part counts and merge backlog | system.parts, system.merges |
| Async insert queue | system.asynchronous_metrics, system.asynchronous_inserts |
| CPU and OS-level wait | system.asynchronous_metrics, node exporter |
A quick health check during an incident:
SELECT
    user,
    count()                                AS running,
    formatReadableSize(sum(memory_usage))  AS total_memory,
    max(elapsed)                           AS longest_s
FROM system.processes
GROUP BY user
ORDER BY running DESC;
If one user (often the batch or export user) dominates the list, you've found the reason dashboards are slow, and section 6 tells you how to stop it from happening again.
Checklist
| # | Step | Done when |
|---|---|---|
| 1 | Measure QPS, fan-out and concurrency (Little's Law) | You know your peak concurrent query count |
| 2 | Fix ORDER BY, add MVs / projections for top query shapes | Top 20 query shapes read a small fraction of the table |
| 3 | Round time ranges and enable the query cache for dashboards | Cache hit rate is measurable and stable |
| 4 | Separate settings profiles per workload with tested max_threads | Dashboard and batch users have different limits |
| 5 | Configure concurrency control (max_min_fair under heavy mixing) | Short queries aren't starved by long ones |
| 6 | Set admission limits below the measured knee | Overload is rejected or queued, not spread over everyone |
| 7 | Create workloads with priorities and query slots | Exports can't slow down dashboards |
| 8 | Set per-user and server memory limits | A burst can't take the server down |
| 9 | Batch inserts or enable async_insert with wait_for_async_insert = 1 | Part count stays flat during peak |
| 10 | Route reads across replicas (by tenant), separate compute if needed | Adding a replica increases QPS |
| 11 | Load test with ingestion, cold caches and one replica down | Your SLO holds in the bad case |
TL;DR
- Concurrency ≈ QPS × query time. The fastest way to serve more concurrent users is to make each query cheaper:
ORDER BY, materialized views, projections, dictionaries and skip indexes. - Use the caches. The query condition cache helps repeated filters for free; the query cache returns repeated results instantly if you round time ranges in the application. Size for the uncached case anyway.
- Tune parallelism per workload. Set
max_threadsfrom benchmarks in settings profiles, and use concurrency control (max_min_fair) to share CPU slots fairly. - Admission limits are protection, not capacity. There's no 100-query limit; set your own limits below the measured knee.
- Isolate workloads.
CREATE WORKLOADwith priorities and query slots keeps exports and ETL away from dashboards; separate compute is the strongest isolation. - Keep inserts from hurting reads with batching or async inserts, and a sane partition key.
- Scale with replicas and good routing, and be careful with parallel replicas under high concurrency.
- Test like production: real mix, ingestion running, cold caches, one replica down.
How BlancoByte can help
At BlancoByte we help teams run ClickHouse for user-facing analytics, observability and real-time workloads, both self-managed and on ClickHouse Cloud. For concurrency problems specifically, we can:
- Review your query mix and schema and find the query shapes that consume most of your capacity.
- Design profiles, workloads and admission limits based on load tests with your own data, not generic numbers.
- Plan topology: replicas, routing, separate compute, or a move between self-managed and Cloud.
- Support you in production when the 9:00 spike comes.
If your dashboards slow down when your users show up, get in touch. We're happy to start with a free review of your setup.
References
ClickHouse
- ClickHouse concurrency: how to size for user-facing analytics
- ClickHouse docs: Workload scheduling
- ClickHouse docs:
concurrent_threads_*server settings - ClickHouse docs: Query cache
- ClickHouse docs: Query condition cache
- ClickHouse blog: Introducing the query condition cache
- ClickHouse docs: Inserting data and best practices
- ClickHouse docs: Asynchronous inserts
- ClickHouse docs: Parallel replicas
- ClickHouse docs:
clickhouse-benchmark - ClickHouse docs: Warehouses (compute-compute separation)
From this blog