
Every team that runs ClickHouse has lived this moment.
A dashboard that usually loads in 200 milliseconds suddenly takes eight seconds. Someone pings you in Slack: “Is the database down?” You SSH in, open a client, and start typing the queries you’ve typed a hundred times — system.processes, system.parts, system.replication_queue, system.merges. You’re not monitoring. You’re doing forensics, live, while people wait.
ClickHouse is one of the fastest analytical databases on the planet. But raw speed doesn’t tell you why it slowed down, which table quietly ballooned to thousands of parts, or whether a replica has been falling behind for the last six hours. ClickHouse exposes all of that — through dozens of system tables. It just doesn’t give you a single place to actually see it.
That gap is exactly what BlancoByte ClickHouse Console was built to close.
“Is my cluster healthy — right now?”
(Health Dashboard)
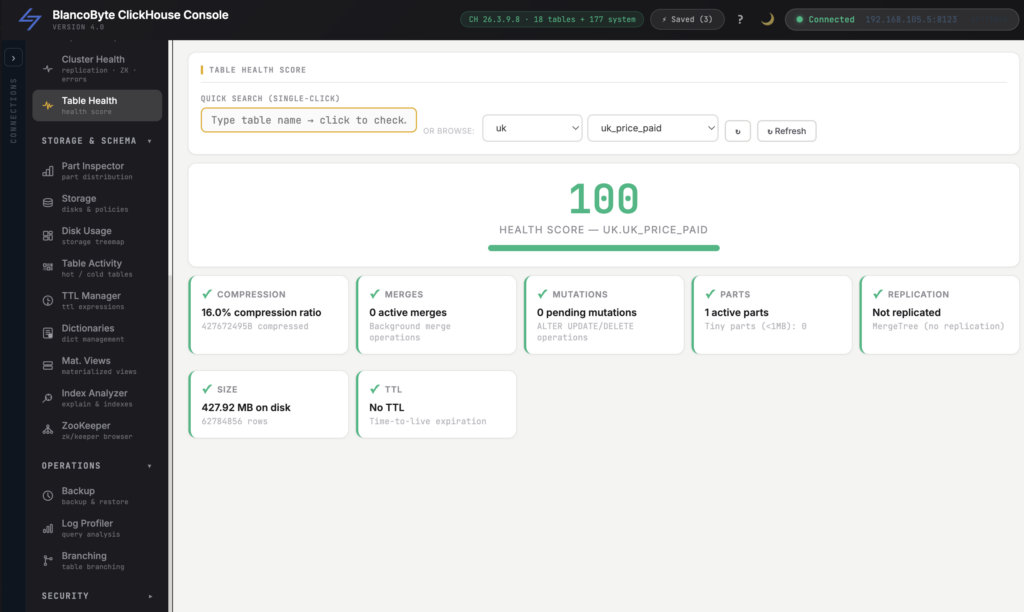
Most monitoring setups can answer “what was the CPU at 3 a.m.?” Far fewer can answer the question you actually ask under pressure: is everything okay this second, and if not, what’s wrong?
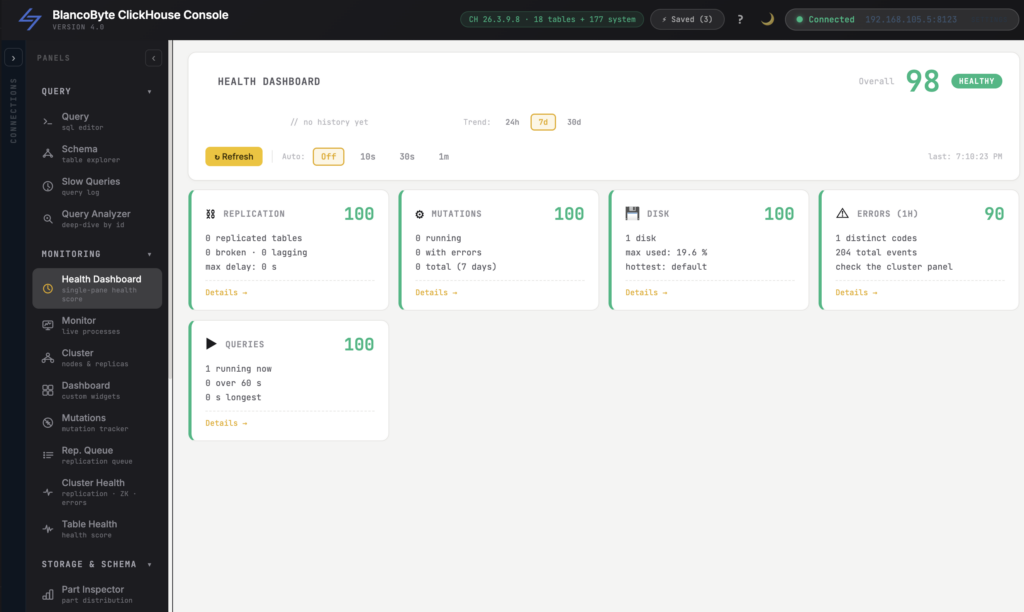
The Health Dashboard gives you one weighted health score across the signals that matter — replication state, merge backlog, parts pressure, error rates — on a single pane. Green means green. When it isn’t, you can see which signal pulled the score down before you’ve finished reading the alert.
And because a single number in isolation lies, the score comes with history: 24-hour, 7-day, and 30-day trends. A cluster that’s been slowly degrading for a week looks very different from one that spiked five minutes ago — and now you can tell them apart at a glance.
See what’s happening, not what happened
(Live Monitor)
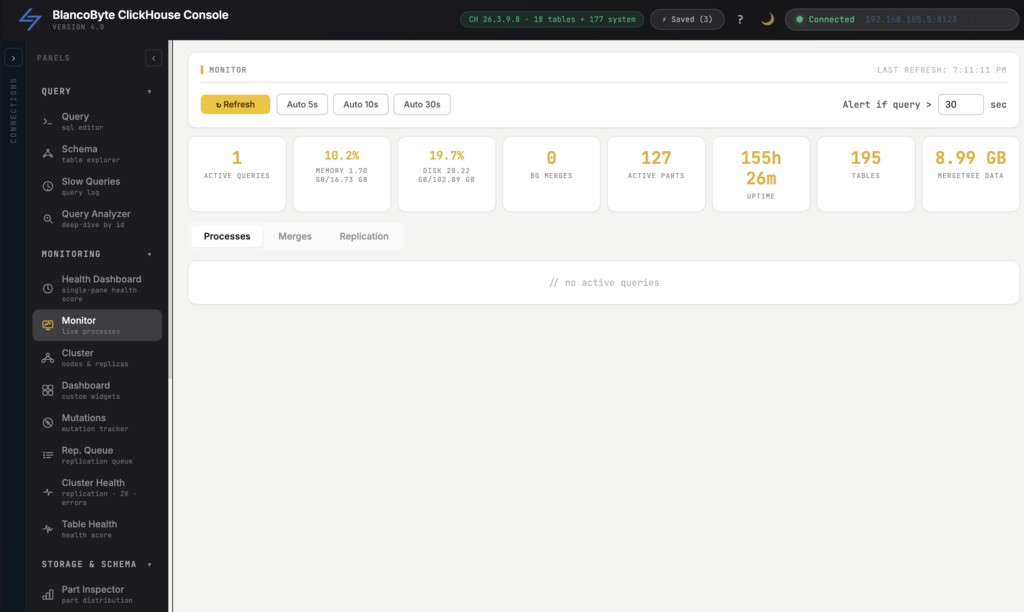
When something is wrong right now, log aggregation that’s two minutes behind isn’t help — it’s history.
The live Monitor shows you active queries as they run: who’s running what, for how long, and how much it’s reading. The runaway SELECT * scanning a billion rows is right there at the top of the list, not buried in a log you’ll grep through tomorrow. Spot it, understand it, and act — without leaving the screen.
The silent killers: parts, disk, mutations, and replication
(Parts · Disk Usage · Mutations · Replication Queue)
ClickHouse rarely dies loudly. It degrades quietly.
Too many parts because inserts are too small and merges can’t keep up. A disk creeping toward full because an old partition never got dropped. A mutation that’s been “in progress” far longer than anyone realizes. A replication queue that’s growing faster than it drains.
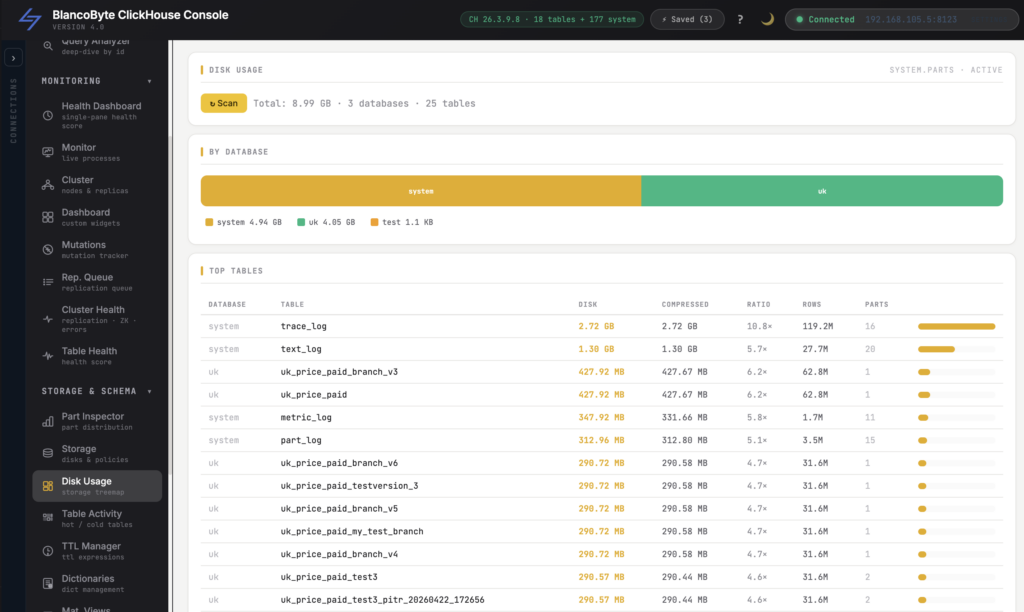
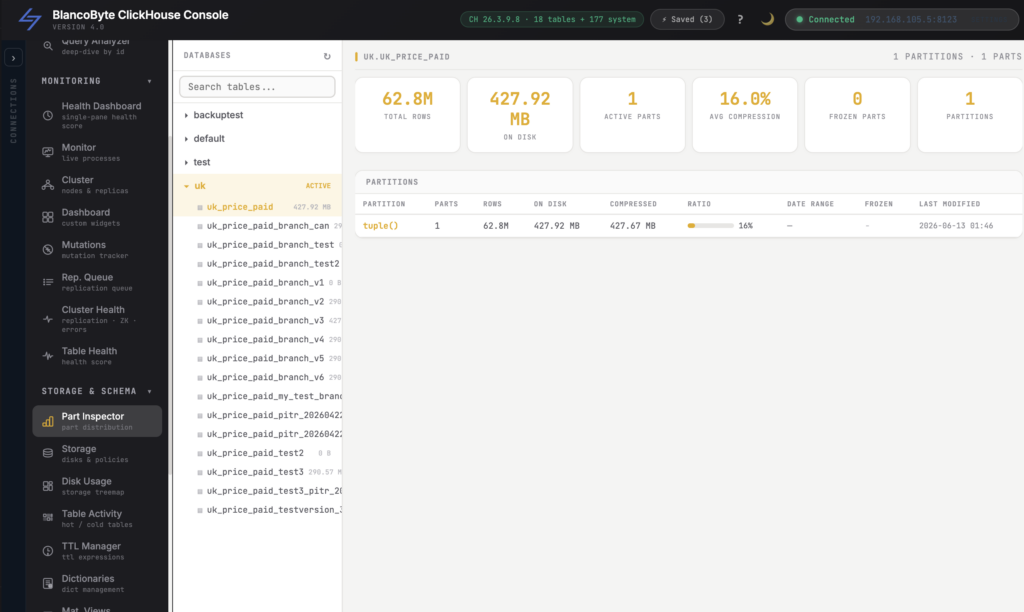
Each of these is invisible until it’s an incident — unless you’re looking. BlancoByte Console surfaces them as first-class views: a disk-usage treemap that makes the biggest consumers obvious, live mutation and replication-queue tracking, and parts visibility per table. You stop discovering these problems from a 2 a.m. page and start catching them on a Tuesday afternoon.
Know which tables are hot — and which are dead weight
(Table Activity Heatmap)
Not every table earns its storage. Some are queried constantly; others haven’t been touched in months but still cost you disk, merges, and backup time.
The Table Activity Heatmap turns read/write patterns into something you can see in a second — hot tables glowing, cold tables fading. It’s the difference between guessing what to optimize, archive, or drop and knowing. (It’s also a quiet ally for data-minimization and retention reviews, when someone asks why you’re still storing something.)
From “this query is slow” to “here’s exactly why”
(Slow Query Log → Query Analyzer with EXPLAIN)
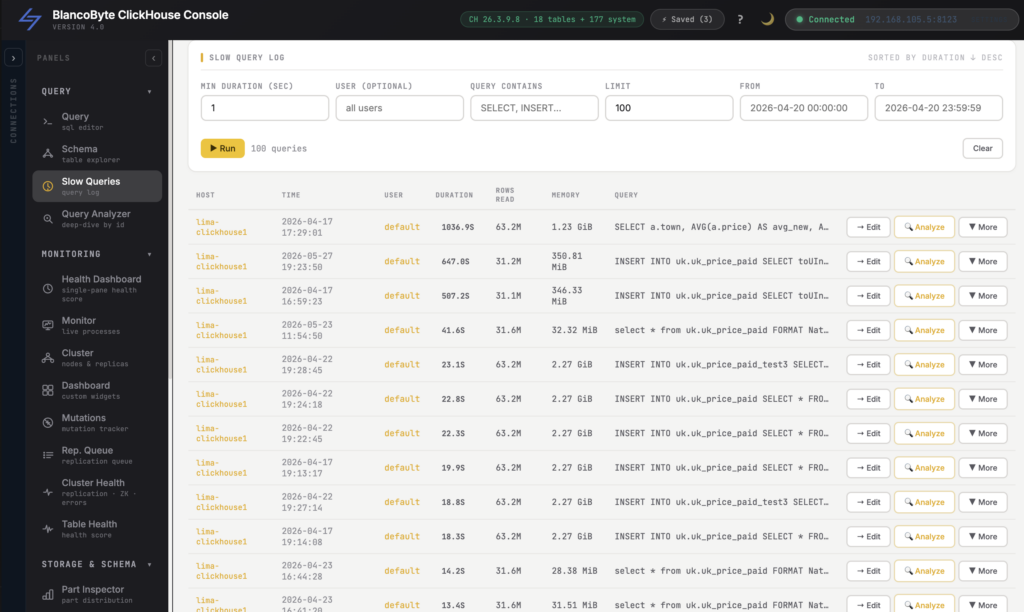
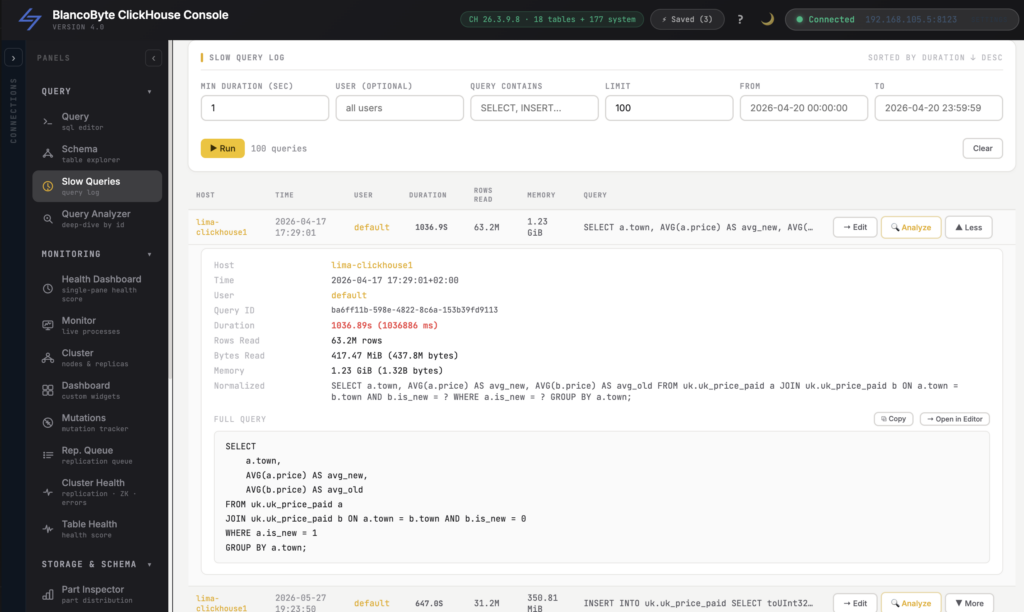
“The dashboard is slow” is a symptom. The Slow Query Log turns it into a suspect — the specific query, its duration, the rows and bytes it read.
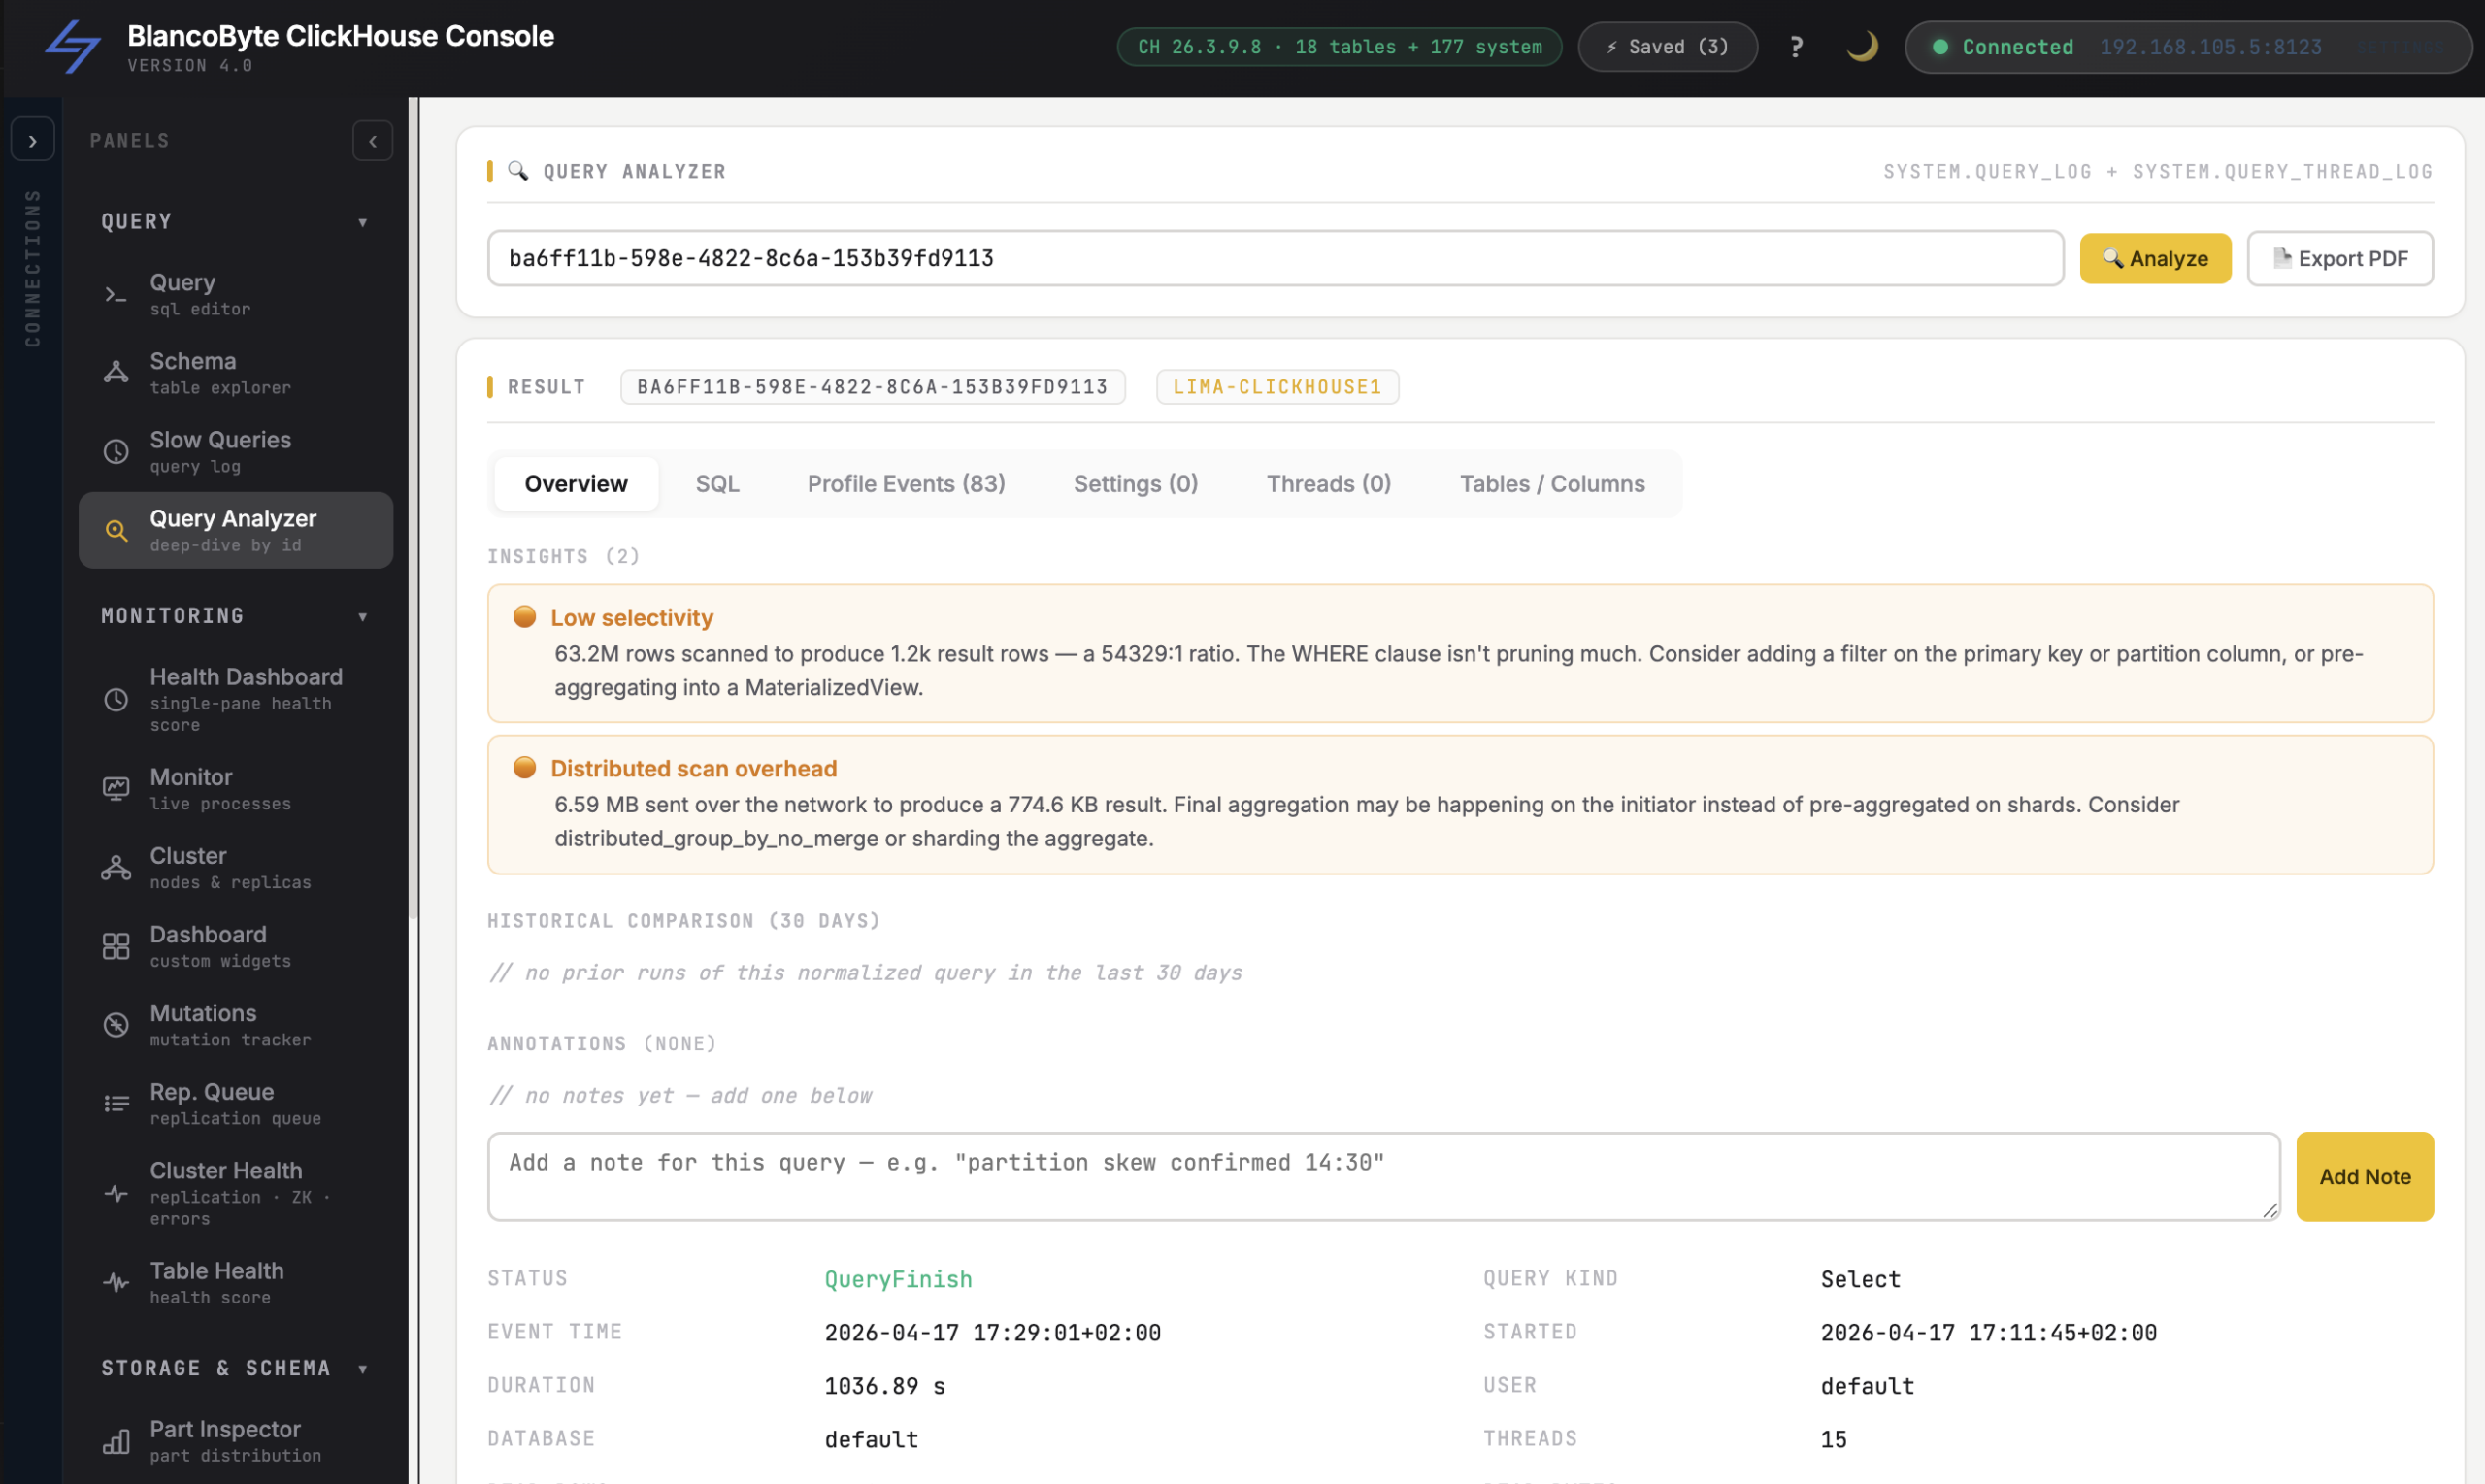
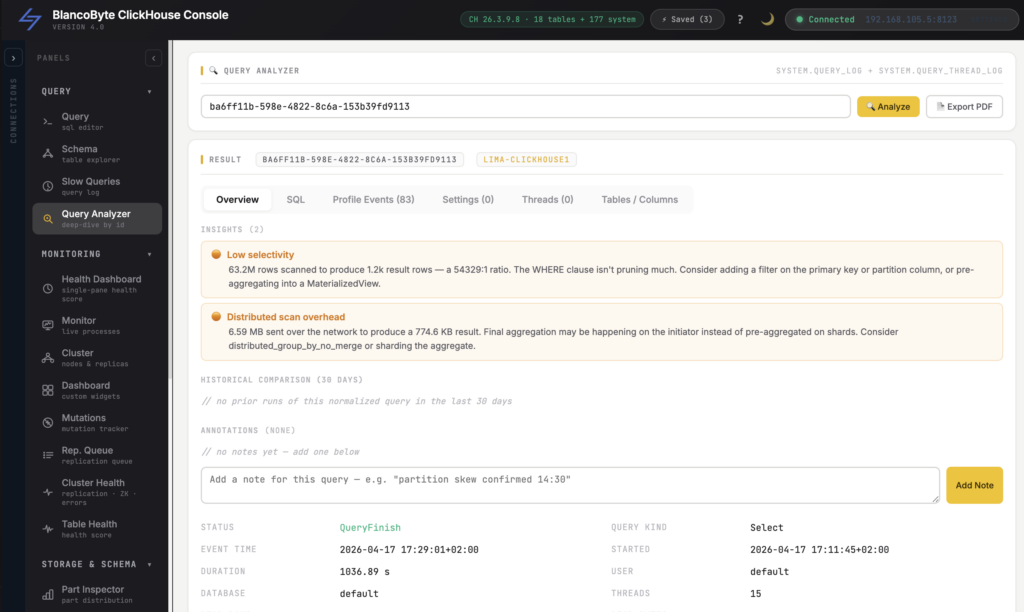
Then the Query Analyzer takes you from suspect to root cause. Drill into a single query_id and walk its EXPLAIN output — PLAN, PIPELINE, ESTIMATE — to see what ClickHouse actually did: the index it skipped, the partitions it scanned, the join that exploded. No more guessing which WHERE clause to blame. You read the plan, you see the problem, you fix the right thing the first time.
And that’s just the surface
Everything above is the part you reach for during an incident. But day-to-day operations need depth, too — and it’s all in the same console, behind the same single pane:
- Cluster & topology — server health, cluster health, and a live topology view so you always know the shape of what you’re running.
- Coordination layer — ZooKeeper / Keeper status, because half of “ClickHouse is weird today” actually lives there.
- Schema & data lifecycle — TTL rules, dictionaries, materialized views, a schema analyzer, and a Schema Drift Tracker that records every DDL/DCL change so “who altered this table?” is never a mystery.
- Cost & accountability — per-user cost breakdowns and a scan-cost trend chart, so you can see who is reading what — and have a real conversation about that one query scanning a billion rows every five minutes.
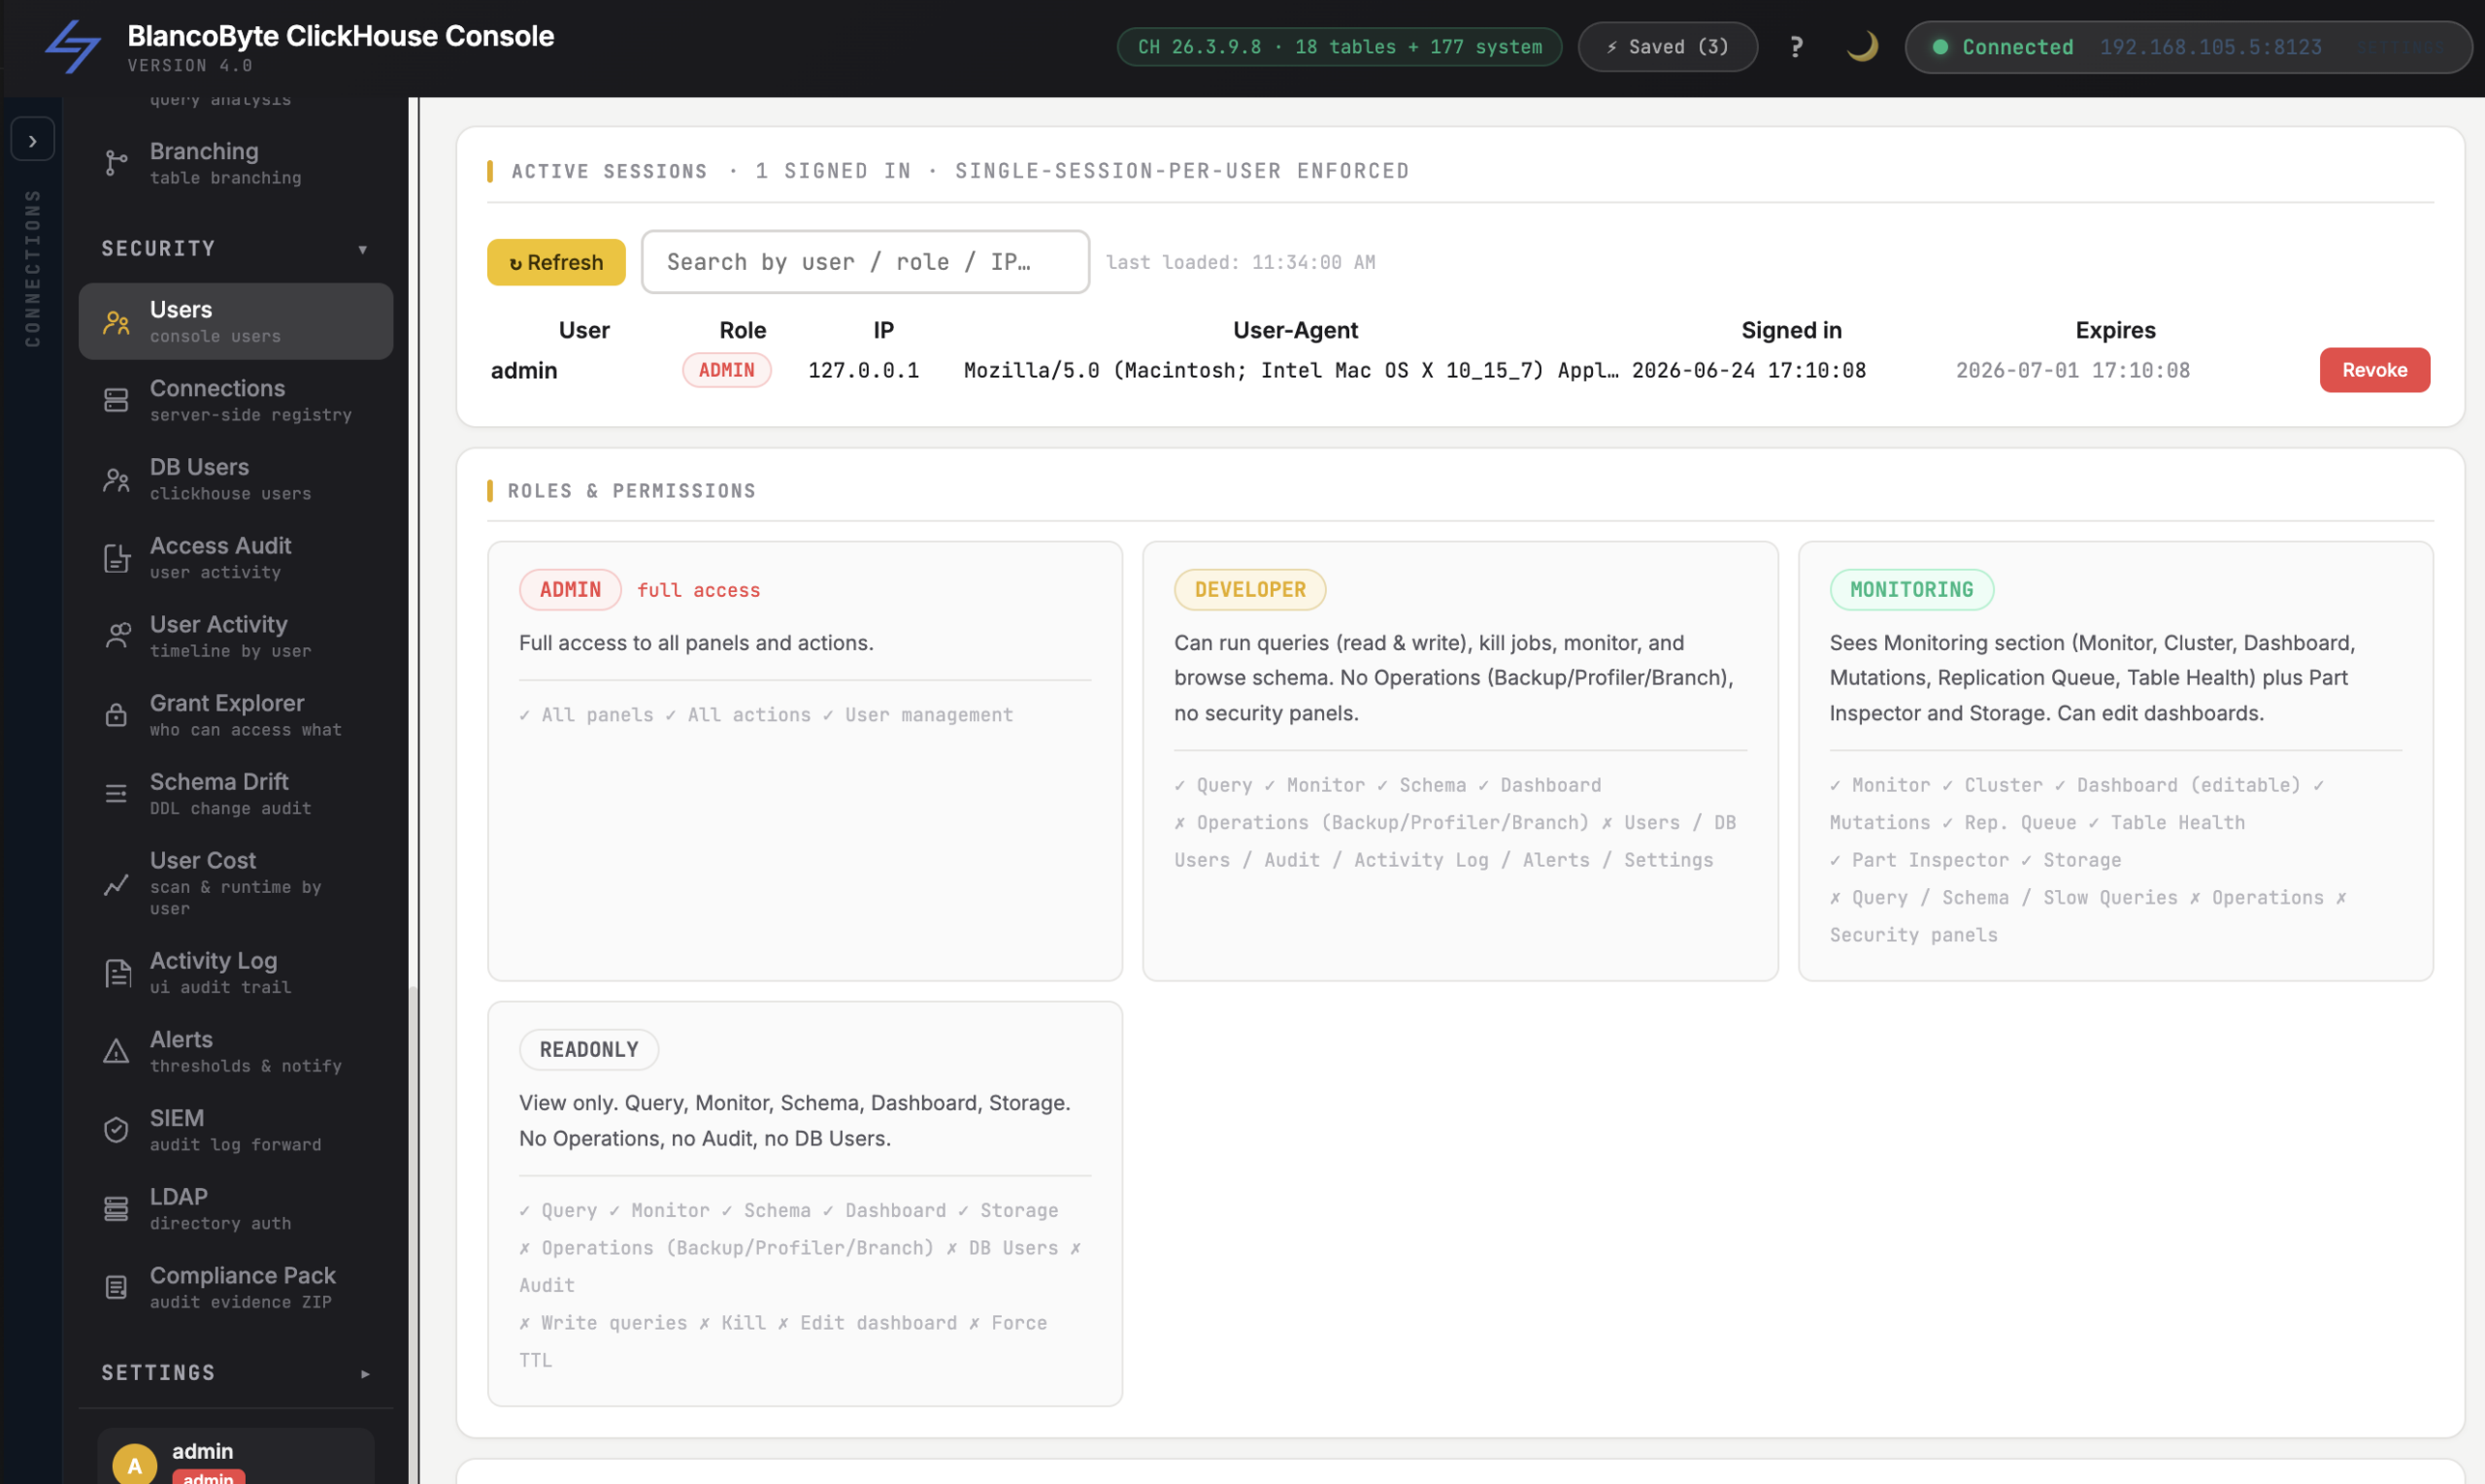
- Audit & governance — full activity timelines, per-user audit trails, alerts, plus SIEM and LDAP integration and one-click compliance/audit exports when an assessor comes knocking.
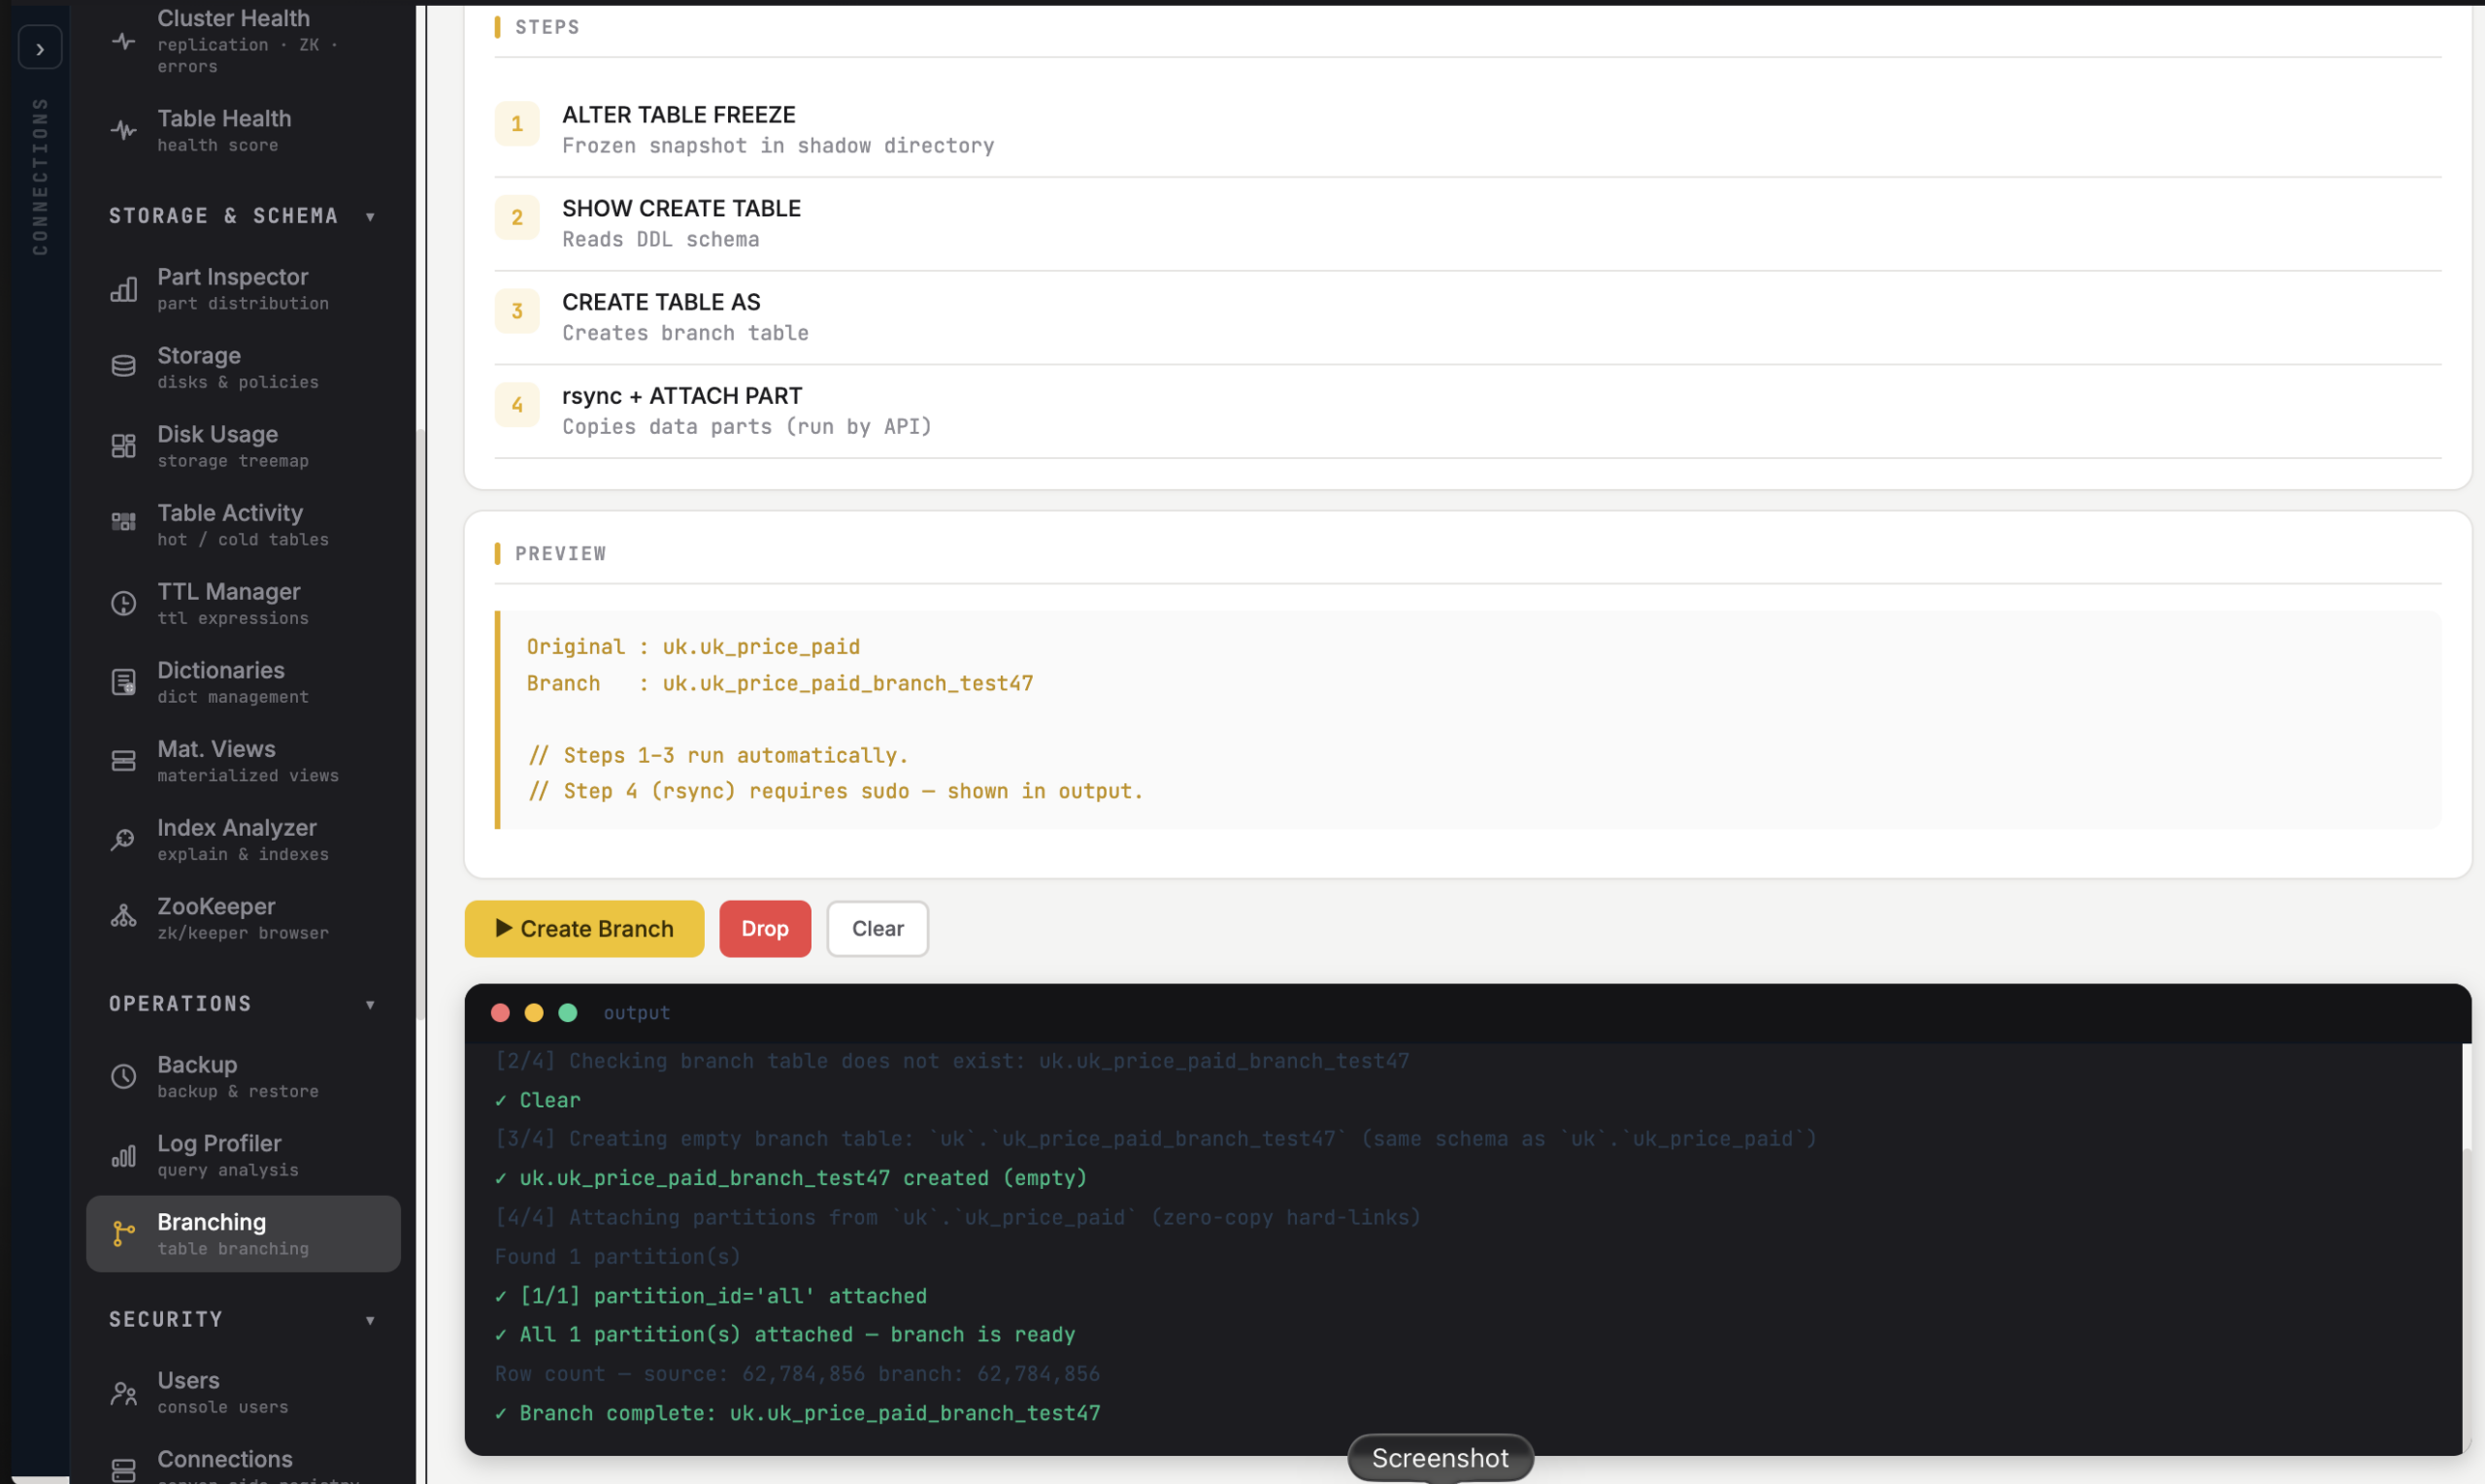
- Recovery & deep dives — point-in-time recovery, a log profiler, and query branches for safe experimentation.
You don’t have to wire up five tools, a metrics stack, and a wiki to get there. It’s one console — from “is the cluster healthy right now?” all the way down to “who changed this grant last Thursday?”
Reactive is expensive. Proactive is the whole point.
Here’s the real cost of monitoring ClickHouse the hard way: it isn’t just the incidents. It’s the tribal knowledge that lives in one engineer’s head, the runbook that’s really just “queries I remember,” and the fact that your visibility is only as good as whoever happens to be awake.
Pulling all of it into one console changes the shape of the job. Instead of reacting to outages, you watch a trend bend the wrong way and step in early. Instead of three senior engineers who “just know” where to look, anyone on the team can open one screen and read the cluster’s health like a vital-signs monitor. Instead of forensics, you get foresight.
ClickHouse already gives you the data. BlancoByte ClickHouse Console gives you the answers — health, live activity, the silent killers, hot-and-cold tables, and query-level root cause, all in one place.
Fast is great. Fast and observable is what keeps you out of the 2 a.m. Slack thread.
Running ClickHouse in production? I’d genuinely like to hear it: what’s the first system table you reach for when things go sideways — and what do you wish you could see without typing a single query? Drop it in the comments.