
Reading EXPLAIN PLAN, EXPLAIN PIPELINE, ESTIMATE TREE, and ESTIMATE COST in ClickHouse — and why every operator should
Every ClickHouse engineer eventually has The Conversation. A query that ran in 200ms on staging takes 18 seconds in production. A simple GROUP BY is somehow scanning 480GB instead of 4. A WHERE clause that looks like it should hit the primary index turns out to be doing a full-table sweep on three replicas at once.
You debug. You read system.query_log. You stare at the SQL again. You wonder out loud whether maybe the optimizer is broken.
The optimizer isn’t broken. It just isn’t telepathic. It can only act on what it sees — the schema, the partition key, the sort key, the filters you actually wrote. If you want to know what it’s about to do, you have to ask.
That’s what EXPLAIN is for.
This post walks through the four EXPLAIN modes that matter most for day-to-day query work — PLAN, PIPELINE, ESTIMATE TREE, and ESTIMATE COST — what each one tells you, and why all four belong in the same workflow.
1. EXPLAIN PLAN — the logical view
EXPLAIN PLAN returns the logical query plan: the tree of operations ClickHouse will perform on your query, expressed in its own internal vocabulary. Filters, joins, aggregations, projections, sort steps, limit pushdowns — all visible as a structured tree.
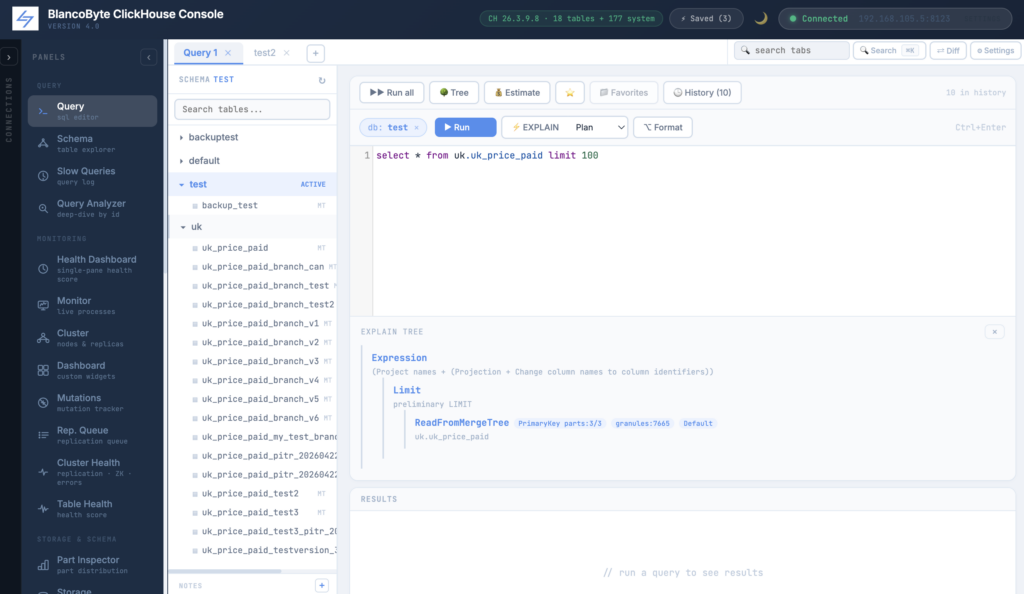
This is the question “what is the engine about to do, in principle?” — independent of how it parallelises or which physical readers it picks.
What to look for:
- Where the filter lands. A
WHEREclause that ends up below the read step means partition pruning and the primary-key index can do real work. One that ends up above the read step means you’ll scan everything first and filter in memory. - Join order. ClickHouse joins are notoriously sensitive to which side is on the right; the plan shows you which side it picked.
- Subqueries materialised vs streamed. A subquery shown as a separate read step often indicates a materialisation point — a place where intermediate data lives in memory.
- Aggregation grouping. Distinct keys per shard vs cluster-wide aggregation make an enormous difference at scale.
If you only ever look at one EXPLAIN mode, look at this one. It’s the closest answer to “did the engine understand my query the way I meant it?”
2. EXPLAIN PIPELINE — the physical view
If PLAN is the recipe, PIPELINE is the kitchen.
EXPLAIN PIPELINE shows you the execution pipeline: the graph of processors that will be wired together to actually run the query, including the parallelism strategy. Each plan step becomes one or more processors, and processors are linked by ports that data flows through.
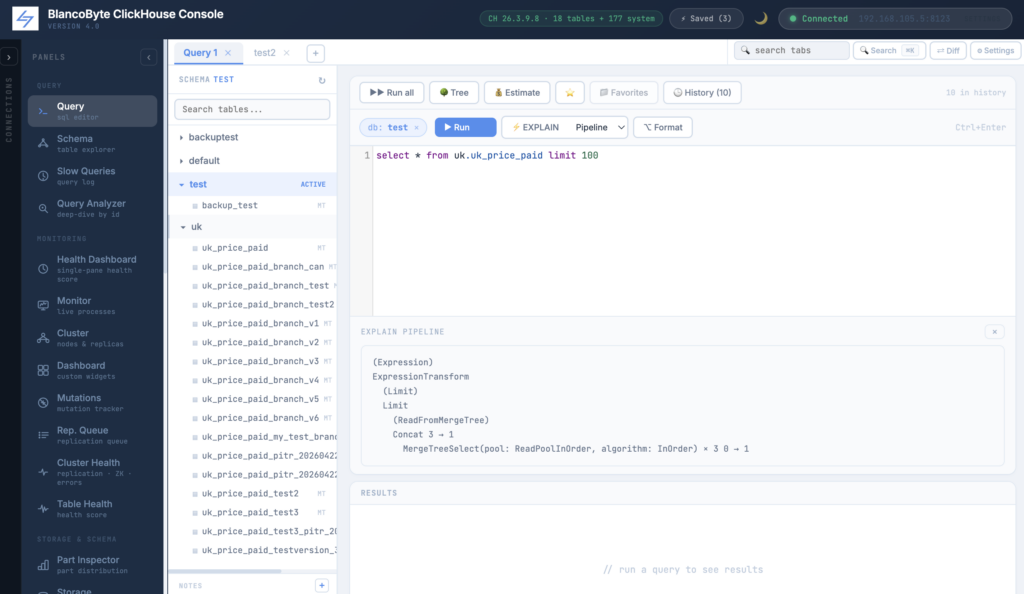
The PIPELINE view answers questions PLAN can’t:
- How many parallel readers will the query spawn? PLAN says “read”; PIPELINE shows “8 ReadFromMergeTree processors fanning into a Resize”. That’s directly tied to your
max_threadssetting and the table’s part count. - Where is the funnel? A pipeline that fans wide and then narrows hard before the next operation — say, 32 readers feeding into a single MergingAggregated — is a candidate for backpressure. Memory builds on the wide side.
- Is the network in the critical path? For distributed queries, the pipeline shows the boundary between remote readers and the local merge step. Slow shards become visible here.
This is the mode that explains why a query whose PLAN looks fine can still feel slow: the logical plan is clean, but the physical pipeline has a bottleneck.
3. ESTIMATE TREE — the volume forecast
EXPLAIN ESTIMATE is where ClickHouse stops describing what it will do and starts telling you how much. In tree form — what we call ESTIMATE TREE in the console — every operation gets annotated with the rows and granules it expects to touch.
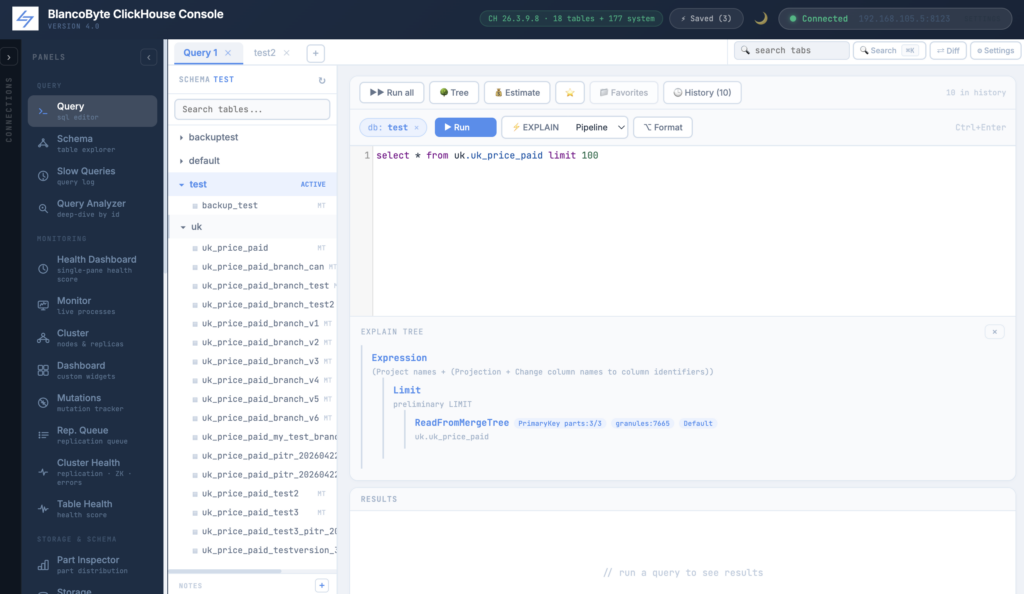
Reading an ESTIMATE TREE the first few times is genuinely surprising. You write a query that feels small. You see the tree. The leaf node says marks: 18,432. Each mark is 8,192 rows by default. You’re about to read 150 million rows because your filter doesn’t align with the sort key.
What ESTIMATE TREE makes obvious:
- Selectivity vs scan size. Two
WHEREclauses can both narrow the output to 10,000 rows — one by skipping 98% of granules, the other by reading everything and filtering after. The result row count is identical; the scan size is 50x apart. - Partition pruning effectiveness. Did the date filter actually drop partitions? The estimate row tells you.
- The cost of leading-wildcard predicates.
WHERE col LIKE '%foo'makes the index unusable; ESTIMATE TREE shows the read step ballooning back to full scale. - Whether the optimizer believes your filter at all. Sometimes the estimate ignores a predicate ClickHouse can’t prove statically — that’s a signal to rewrite.
This is the view that prevents queries from accidentally costing a fortune in scanned bytes.
4. ESTIMATE COST — the granule-level breakdown
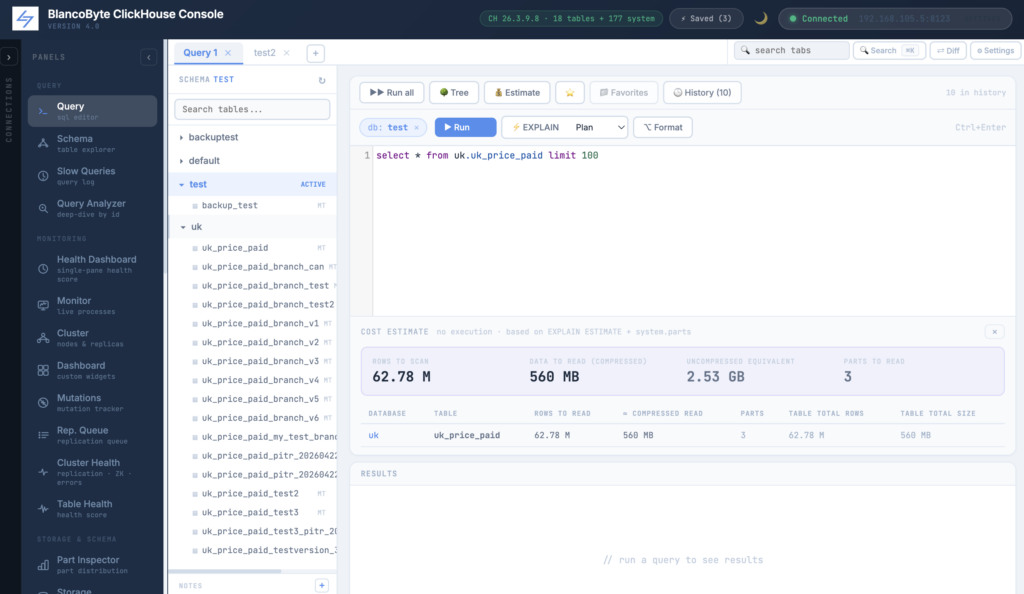
ESTIMATE TREE shows what each step will scan. ESTIMATE COST breaks that down to the level of granules and bytes, per source — and aggregates it into a number you can compare against last week’s run.
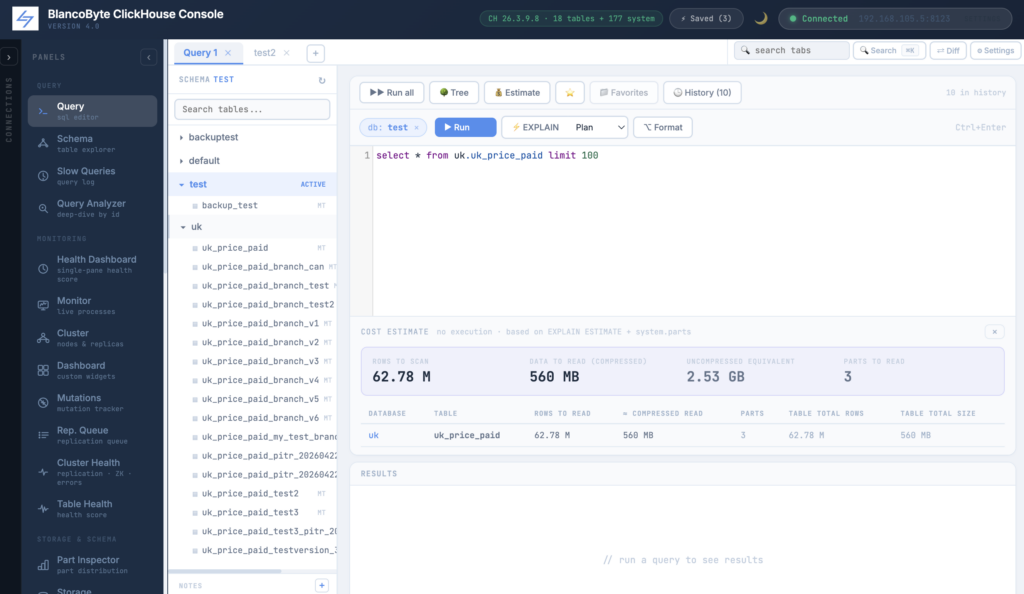
It answers:
- How many granules will be read, per part?
- How many bytes does that translate to, compressed and uncompressed?
- What share of the cost is coming from each shard, replica, or table?
- Is the read amplification ratio (rows-returned vs rows-scanned) sane?
The reason this matters is that scanned bytes — not result rows — is what your query actually costs. In a managed setup it’s literal dollars. On a self-hosted cluster it’s I/O contention, page-cache pressure on neighbouring queries, and lifetime of your SSDs.
A query that returns 12 rows but scans 800GB is almost always a bug. ESTIMATE COST surfaces those at the moment of writing the query, not on the next billing cycle.
Reading them together — the workflow
These four modes work as a sequence, not in isolation:
- PLAN — Is the engine doing what I expected?
- PIPELINE — Will it parallelise the way I expect?
- ESTIMATE TREE — Where, structurally, is the volume?
- ESTIMATE COST — How much is that volume going to be, in concrete terms?
If you only check (1), you’ll miss the wide-then-narrow pipeline bottleneck. If you only check (4), you’ll see “this query is expensive” without knowing why structurally. Together they cover the four interesting layers — semantic, physical, structural, quantitative — and once you’ve internalised the reading, you’ll never write a heavy query the same way again.
Why every operator should know these
This isn’t a luxury for the DBA track. It’s table stakes for anyone running ClickHouse seriously, and there are three concrete reasons.
Cost predictability. In a cloud or shared-cluster setting, scanned bytes is the dominant cost vector. EXPLAIN moves that variable from “discover at the invoice” to “preview at write-time”.
Self-service performance. Most query slowness has the same handful of root causes — non-aligned sort keys, partition pruning misses, JOIN-side mistakes, leading-wildcard LIKEs. EXPLAIN turns each of these from “ticket the DBA” into “fix it yourself in five minutes”.
Compliance and review-ability. When auditors or capacity planners ask “why does this report cost so much?”, EXPLAIN is what makes the answer reproducible. Without it you’re guessing; with it, you have a concrete decomposition.
In the BlancoByte ClickHouse Console
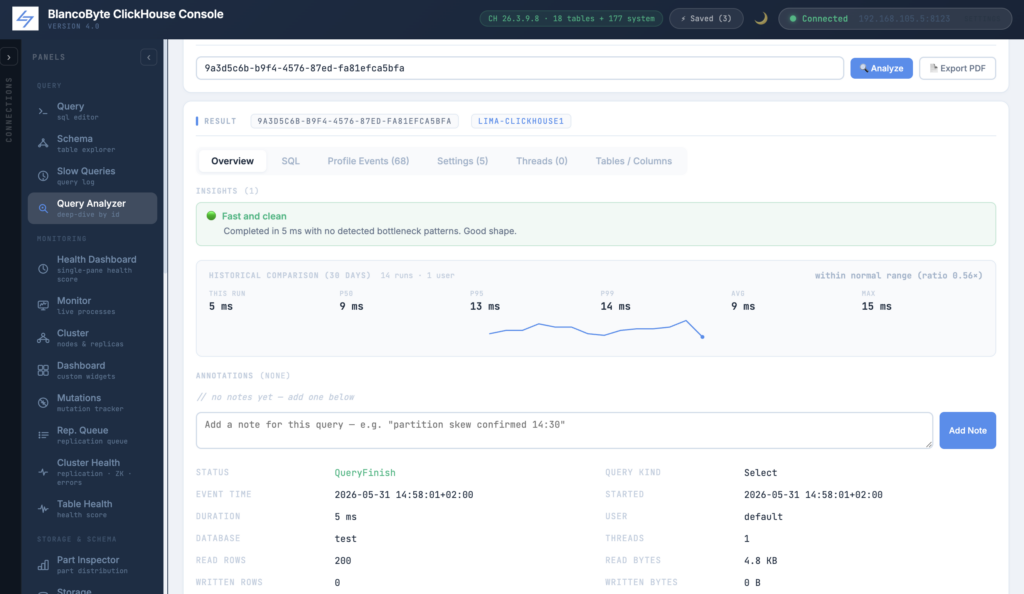
All four modes are first-class citizens in the console’s Query Analyzer. You don’t have to copy-paste a query into a second window and parse text output by hand:
- A switcher at the top of the Analyzer toggles between PLAN / PIPELINE / ESTIMATE TREE / ESTIMATE COST.
- Each mode renders with proper hierarchy, colour-coded steps, and inline annotations for row and granule counts.
- The cost view aggregates across shards and replicas so distributed queries explain cleanly.
- Every EXPLAIN run is itself an audit event, so you can ask “what did the team explain on this table last week?” — useful both for SRE pattern-mining and for compliance review.
Wrapping up
EXPLAIN is the cheapest form of observability ClickHouse offers. It runs in milliseconds, it doesn’t touch the data, and it can save you from queries that would otherwise have run for hours. It’s also one of the most under-used features of the engine — partly because the raw text output isn’t friendly, partly because most teams default to “ship and see”.
The four modes — PLAN, PIPELINE, ESTIMATE TREE, ESTIMATE COST — each answer a question the others can’t. Read them together, and you move from “I think this query will be fast” to “I know exactly what it’s going to do and what it’s going to cost.”
That shift is the difference between operating ClickHouse and running it on autopilot.