Most MongoDB performance problems trace back to indexes — but it is never as simple as “add an index and it gets faster.” The existence of an index does not mean it helps your query. Sometimes an index is there but useless; sometimes the problem is not the index at all, but somewhere else entirely.
In this post I will walk through the lessons from a real production performance analysis, and show you how to read MongoDB indexes and make the right call. The examples are adapted from the behavior of a real system; the names are generic.
Measure first: never touch anything without explain
The first rule of index optimization: do not guess, measure. MongoDB tells you exactly what a query does. The three most important numbers are:
keysExamined— how many index keys were scanneddocsExamined— how many documents were read from disk/memorynReturned— how many documents were actually returned
In the ideal case these three are close to each other. If a query returns 50 documents, it should scan roughly 50 keys and read roughly 50 documents. The more skewed this ratio, the more waste the query is doing.
You inspect a query like this:
db.orders.find({ status: "active", customerId: "C-1024" })
  .sort({ createdAt: -1 })
  .explain("executionStats")
The winningPlan in the output tells you whether it is a COLLSCAN (the whole collection is scanned) or an IXSCAN (an index is used). But as we will see shortly, seeing IXSCAN does not mean everything is fine.
Problem 1: No index at all (COLLSCAN)
The most basic case. If there is no index for the field a query filters on, MongoDB has to read every single document in the collection, one by one. This is called a collection scan (COLLSCAN).
A real example: in a history collection of about 190,000 documents, there was no index except _id. This query was running:
db.history.find({
  tenantId: "T-0612",
  version: 22,
  filename: "definition.orders.xml"
})
All three fields were equality filters, but none of them was indexed. The result: to find a single document, all 188,544 documents were scanned, 103 MB of data was read, and the query took 354 ms — just to return 1 document.
The fix is simple: a compound index covering the three equality fields:
db.history.createIndex({
  tenantId: 1,
  version: 1,
  filename: 1
})
With this index the scan drops from 188,544 documents to the single matching one. The 103 MB read disappears entirely.
Problem 2: The index exists but is inefficient (not selective)
This one is sneakier. explain shows you IXSCAN, you say “the index is being used,” but the query is still slow. Why? Because the index only covers part of the query.
A real example. This query filtered on four fields:
db.audit_processes.find({
  tenantId: "T-0378",
  published: 2,
  isDeleted: 0,
  "exportProfile.KEY_65": "1"
}).sort({ processNumber: 1 })
The existing index was only { tenantId: 1, processNumber: 1 }. So of the four filters, it covered just one (tenantId). The result was:
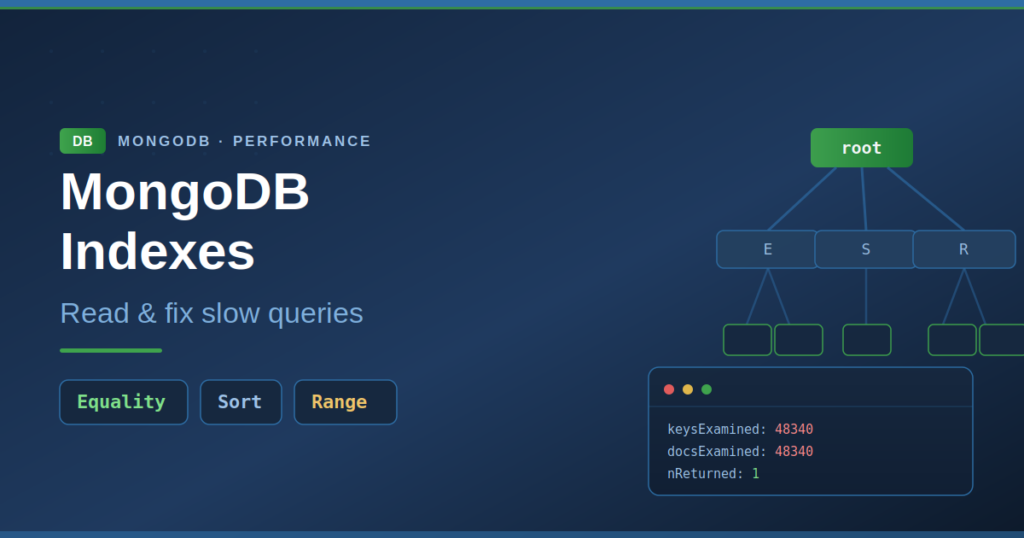
keysExamined: 48,340docsExamined: 48,340nReturned: 1
The index narrows only by tenantId, pulls all 48,340 documents belonging to that tenant off disk (284 MB!), then applies the other three filters in memory. 48,340 to 1 — a terrible ratio. Duration: 3,282 ms.
The index was not missing; it just was not selective enough. Because the other three filter fields were not in the index, they could not narrow the scan.
The fix was a compound index that includes all four filter fields. But the order of the fields is critical — which brings us to the most important rule.
The golden rule: ESR (Equality, Sort, Range)
The ESR rule determines the order in which you place fields in a compound index:
- E — Equality: equality filters first (
status: "active",isDeleted: 0) - S — Sort: sort fields in the middle (
sort: { createdAt: -1 }) - R — Range: range filters last (
price: { $gt: 100 },$in,$gte)
Why this order? Because an index is a sorted structure. First you narrow down to a single tight range with the equalities; that range is already sorted, so the sort comes for free; and the range you left for last then operates on that narrow, sorted set.
Back to the example above — all four fields were equality, and one was also the sort. The correct index is:
db.audit_processes.createIndex({
  tenantId: 1,        // E
  published: 1,       // E
  isDeleted: 1,       // E
  "exportProfile.KEY_65": 1,  // E
  processNumber: 1    // S
})
With this index MongoDB first narrows by the four equality fields (from 48,340 down to 1 document), then reads the processNumber order directly from the index. Both the mass FETCH and the in-memory SORT disappear.
An example where ESR rescues the sort
Sometimes the sort is exactly the problem. Consider this query:
db.controls.find({ appName: "app-3.5.15" })
  .sort({ groupName: 1, parentId: 1, order: 1 })
The existing index was only { appName: 1 } — it covered the filter but not the sort. MongoDB pulled 958 documents and sorted them in memory (hasSortStage: true). That is an extra cost.
Per ESR: equality (appName) first, then the three sort fields:
db.controls.createIndex({
  appName: 1,       // E
  groupName: 1,     // S
  parentId: 1,      // S
  order: 1          // S
})
Now MongoDB reads the data from the index already sorted; it does not need to sort in memory. hasSortStage disappears.
Special cases like $in and $mod
A single query can contain equality, $in, and $mod all at once:
db.job_queue.find({
  jobType: "EXPORT",         // equality
  jobStatus: "SCHEDULED",    // equality
  tenantId: { $in: [...] },  // range-like
  sequence: { $mod: [3, 2] } // CANNOT use an index
})
Two points here. First, $in behaves like a range, so per ESR it comes after the equalities. Second, $mod can never be served by an index — it is a mathematical operation, and there is no point putting it in the index.
The correct index:
db.job_queue.createIndex({
  jobType: 1,      // E
  jobStatus: 1,    // E
  tenantId: 1      // R ($in)
})
MongoDB first narrows with the two equalities, resolves the $in from the index, and applies the $mod on the small remaining set. Instead of scanning 97,000 documents, perhaps a few hundred remain.
Problem 3: Covered queries — never reading the document at all
Sometimes the index is selective, the ratio is perfect (keysExamined = docsExamined = nReturned), yet the query is still slow. That is because MongoDB reads the entire document from disk even though you only asked for a couple of fields.
Example:
db.processes.find(
  { tenantId: "T-0108" },
  { title: 1, processNumber: 1 }  // we only want 2 fields
)
The index { tenantId: 1 } worked perfectly: 1,531 keys, 1,531 documents, 1,531 results. But it took 1,917 ms — because to return just 2 small fields it read 1,531 full documents (134 MB) from disk.
The fix is a covered query: add the requested fields to the index too. Then MongoDB reads the data directly from the index and never touches the document (the FETCH stage disappears):
db.processes.createIndex({
  tenantId: 1,
  processNumber: 1,
  title: 1
})
For a query to be “covered,” every field — in the filter, the sort, and the projection — must be in the index. In that case the 134 MB disk read disappears completely.
Caution: a covered query is not always a good idea. If the projection contains a large text field like content, adding it to the index bloats the index enormously. Worth it for small fields, harmful for large ones.
Problem 4: Updates follow the same rules
People always think of indexes for find, but an update also has to first find the document it will modify. If that lookup is slow, the update is slow.
db.transactions.updateOne(
  { tenantId: "T-0378", id: 31980 },
  { $set: { ... } }
)
The index was only { tenantId: 1 }. To update a single document, 31,427 documents were scanned (415 MB read), because the id field was not in the index and was being filtered in memory. Duration: 1,605 ms — for one update.
The fix is an index covering both fields in the update’s predicate:
db.transactions.createIndex({ tenantId: 1, id: 1 })Now the update finds its target document directly: docsExamined drops from 31,427 to 1.
The most important lesson: sometimes the index is not the problem
This was the most striking finding of the analysis. Some queries had a perfect index plan — keysExamined = docsExamined = nReturned = 1 — yet still took over a second.
How? Look at this field in the explain output:
storage: {
  data: { bytesRead: 18432, timeReadingMicros: 1122000 }
}
Reading a single 18 KB document took 1,122 ms. The index was flawless (1 key, 1 document). The problem was entirely the disk read — the document was not in RAM (the WiredTiger cache) and had to be read from cold disk.
This is the working set problem: if your frequently accessed data plus indexes do not fit in RAM, MongoDB constantly goes to disk, and no amount of index optimization will fix that. The way to confirm it:
db.serverStatus().wiredTiger.cache["bytes currently in the cache"]
db.serverStatus().wiredTiger.cache["maximum bytes configured"]
db.serverStatus().wiredTiger.cache["pages read into cache"]
If “pages read into cache” is very high and the cache is full, the data is constantly being swapped in and out of disk. The fix is not an index but more RAM, or a smaller working set.
How do you tell? A simple test: run the query twice. If the second run is much faster because it comes from cache, the problem is RAM, not the index.
The invisible cost: unnecessary indexes (index bloat)
Indexes are not free. On every insert/update/delete, MongoDB updates all indexes on that collection. If a collection has 50 indexes, writing a single document updates all 50 at once. If most of them are unused, most of your write work is wasted.
Indexes also occupy RAM — so unused indexes steal the cache space your working set needs.
$indexStats tells you which indexes are actually used:
db.orders.aggregate([{ $indexStats: {} }]).forEach(function(i) {
  print(i.name + " | accesses: " + i.accesses.ops);
});
In a real collection there were 17 indexes; 8 of them had never been used since the last restart (about 2 months) (accesses: 0). So 8 unnecessary indexes were being updated on every write.
But before deleting — three critical warnings
Dropping unused indexes speeds up writes and frees RAM, but do not do it blindly:
$indexStatscounts only since the last restart of THIS node. In a replica set, secondary nodes may serve different queries. An index unused on the primary may be taking read traffic on a secondary. Check on all nodes.- Do not drop unique indexes based on read counts. A unique index may appear to be “never read” yet still enforce data integrity (duplicate prevention). Dropping it risks duplicate records. Confirm with the application team.
- Do not touch GridFS and system indexes. GridFS indexes like
files_id_1_n_1may showaccesses: 0simply because no read happened at that moment, but dropping them breaks GridFS.
And always: perform the drop in a planned maintenance window, documented, in a way you can roll back.
Summary: how to diagnose a slow query
For every slow MongoDB query you face, follow this sequence:
- Run
explain("executionStats"). Is it aCOLLSCANor anIXSCAN? - Look at the three numbers:
keysExamined,docsExamined,nReturned. If the ratio is skewed (e.g. 48,340 : 1), the index is not selective → compound index per ESR. - Is
hasSortStage: true? If so, the sort is not served by an index → add the sort fields to the index. - Perfect ratio but still slow? Look at
timeReadingMicros. If it is high, the problem is disk/RAM, not the index → more RAM or a covered query. - Projection asks for few fields but full documents are read? → consider a covered query.
- Too many indexes on the collection? → find the unused ones with
$indexStatsand clean them up carefully.
MongoDB indexes are powerful, but they are not magic. explain tells you the truth — as long as you know where to look. The biggest mistake is seeing IXSCAN and moving on thinking “okay, it is fast.” The real story is hidden in those three numbers and in timeReadingMicros.