
A browser-based management tool for ClickHouse — query, backup, profile, and branch, all in one place.
We built a lot of internal tooling around ClickHouse over the past year. Scripts for backups, a Python profiler for slow queries, a branching utility for safe testing. They all worked, but switching between terminals, config files, and ad-hoc Python commands was friction we didn’t need. So we packaged everything into a single web interface: BlancoByte ClickHouse Console.
It runs entirely on your own infrastructure. No cloud dependency, no external service — just a Python Flask server you start on the same machine as your ClickHouse instance. Open your browser and everything is there.
Requirements
(.venv) root@lima-clickhouse1:~/clickhouse-console# cat requirements.txt

flask>=2.3.0
clickhouse-connect>=0.7.0
clickhouse-driver>=0.2.7
rich>=13.0.0
boto3>=1.26.0
click>=8.1.0
What’s inside
The console is organized into tools, accessible from the left sidebar. The connection status is always visible in the top-right corner. Once you connect with your host, port, username, and password, the UI shows your ClickHouse version and table count. Everything stays in that session — no data leaves your server.
Query Panel
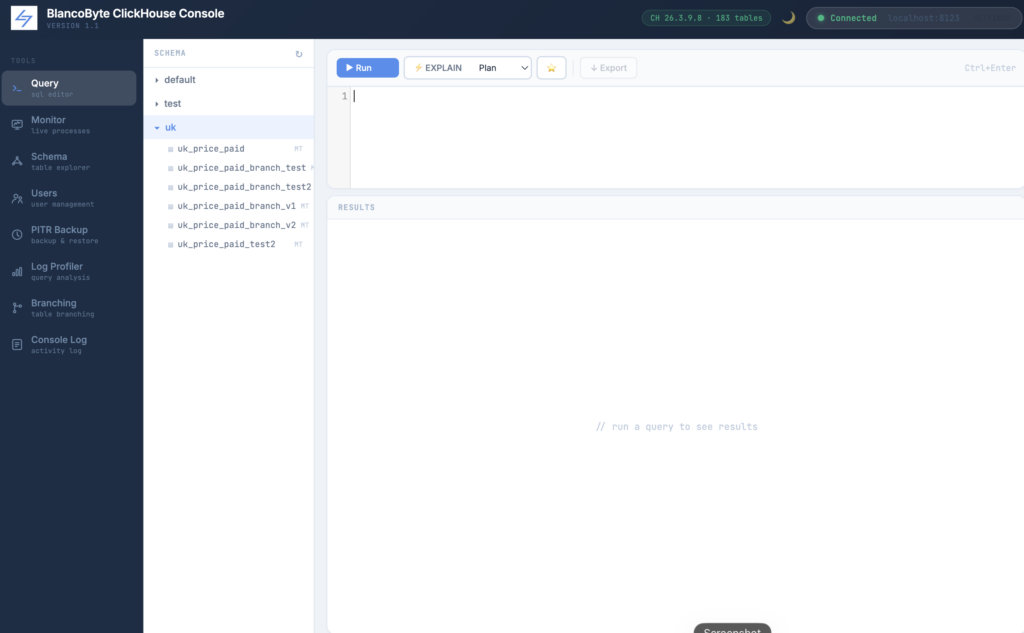
The first thing you see when you open the console is the SQL editor.
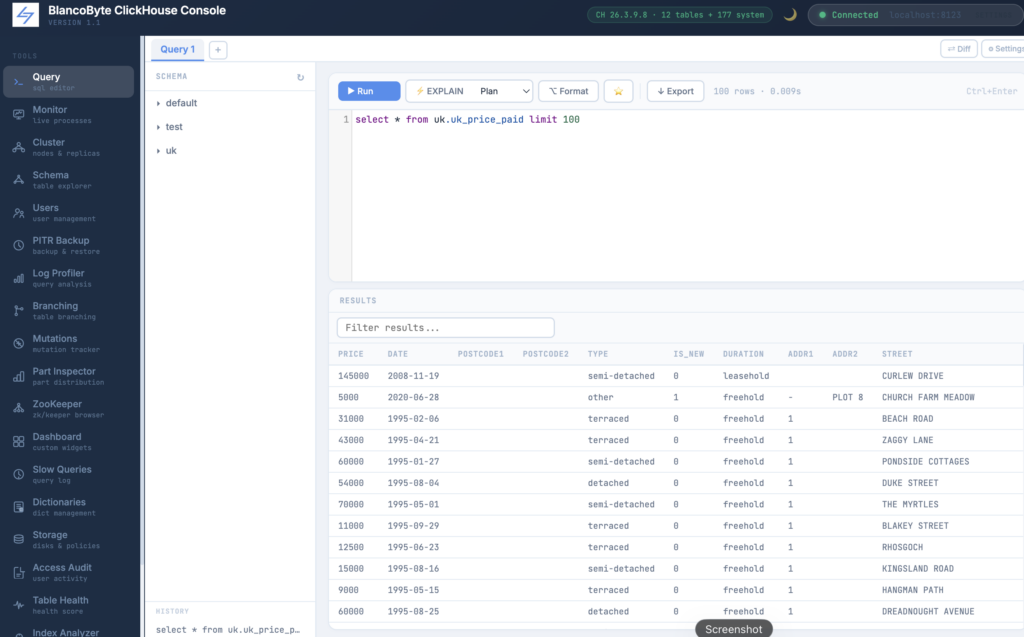
The Query panel is where you spend most of your time. It has a schema tree on the left, a SQL editor in the center, and a results table below.
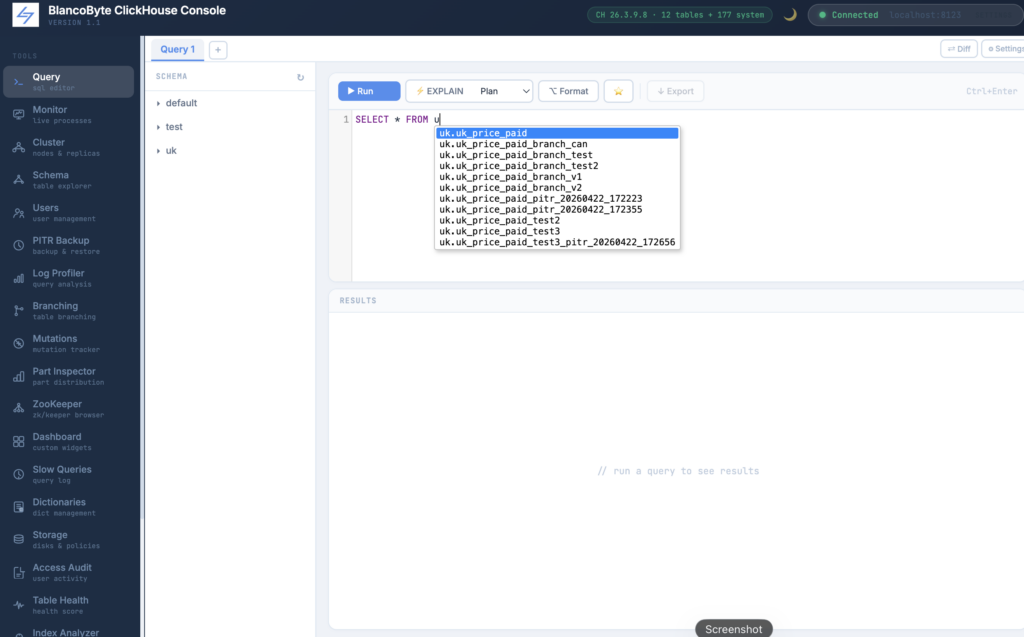
The schema tree lists all non-system databases. Clicking a database expands it and loads its tables. Clicking a table inserts a SELECT * FROM db.table LIMIT 100 into the editor. The tree is lazy-loaded — it only fetches what you open.
You can write multiple queries and run selected one.
The editor understands multiple statements separated by semicolons. When you press Run or Ctrl+Enter, it detects which statement your cursor is in and runs only that one. If you’ve selected text, it runs the selection. This means you can keep a scratchpad of commonly used queries in a single editor and run any of them without deleting the others.
Results show up to 1000 rows. The total row count is always shown regardless of the limit.
Query Result Filter and Sort
After running a query against a large table, scrolling through a thousand-row result set to find a specific value is exactly the kind of friction that slows down analysis. The result table now has an inline filter bar that narrows rows in real time as you type — no re-running the query, no round-trips to the server. Clicking any column header sorts the result ascending, clicking again reverses it, and an indicator shows which column is active and in which direction. A row counter tells you how many rows match your filter versus the total returned. Both the filter and sort state clear independently with a single button, and all of this works on the data already in memory, so there is no latency regardless of row count.
Slow Query Log
The slow query log panel reads directly from system.query_log, which ClickHouse maintains automatically and which contains a complete record of every query that has run on the instance. The panel exposes filters for minimum duration, user, query content, and time range — all applied server-side so you are not pulling the entire log into the browser. Results are sorted by duration descending by default, with each row showing the normalized query pattern, execution time color-coded by severity, rows and bytes read, and peak memory usage. A single button loads any query directly into the SQL editor, which is the most common next step: you see a slow query in the log, you open it in the editor, you start adding EXPLAIN or modifying the WHERE clause.
Multi-Tab Queries
Each tab in the Query panel is completely independent. It has its own SQL content, its own result set, its own run state, and its own query history. Tabs are created with the + button in the tab bar and closed with the ✕ on each tab. You can keep as many open as you need.
Switching tabs saves the current editor content to the outgoing tab and restores the content of the incoming one. CodeMirror reinitializes automatically on each switch, so syntax highlighting is always active regardless of how many tabs you have open.
This removes the need to open multiple browser windows when you want to compare queries or run something in parallel.
Table Diff
The Diff view is accessible from the ⇄ Diff button in the Query panel header. It presents two side-by-side query inputs. Clicking Run Diff executes both queries in parallel against ClickHouse and compares the result sets client-side.
The output is a summary: how many rows exist only in A, how many exist only in B, and how many are identical between the two. The differing rows are displayed in a unified table — rows only in A are highlighted in red, rows only in B in green.
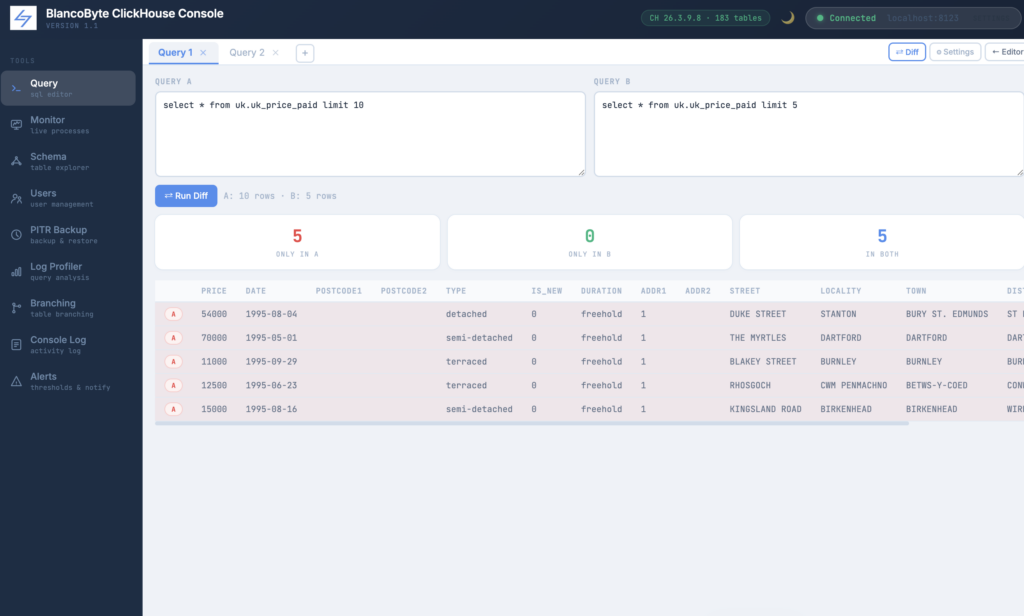
This is particularly useful alongside the Branching feature. You can run the same query against a production table and its branch, then diff the results to verify that a migration did exactly what you expected.
ClickHouse Settings Panel
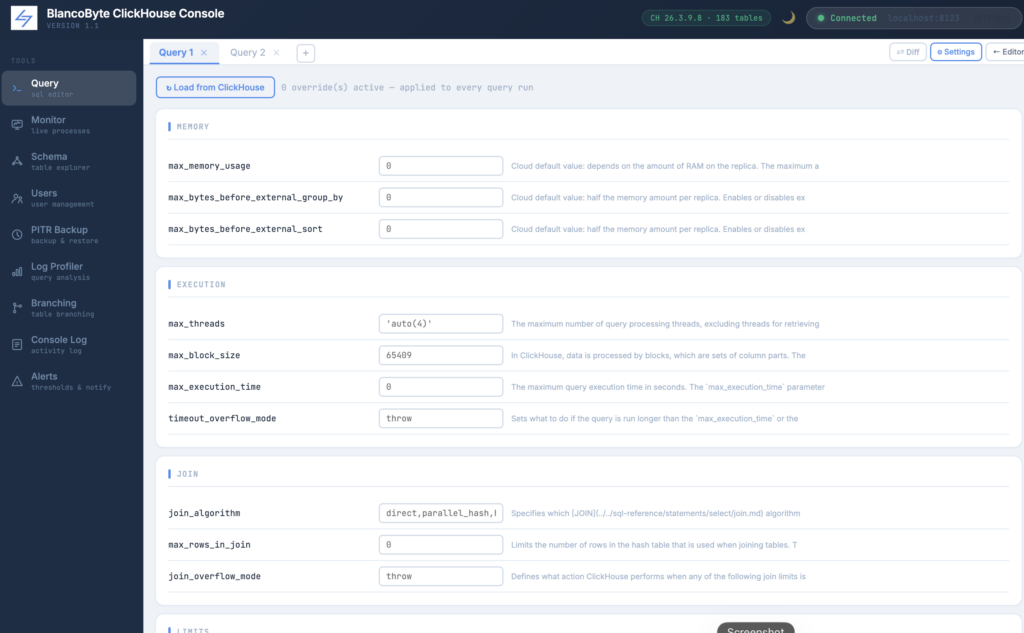
The ⚙ Settings button opens a panel that reads system.settings from your connected ClickHouse instance and lists the most operationally relevant settings in five groups: Memory, Execution, Join, Limits, and Other.
Each setting shows its current server-side value as a placeholder. You can type an override value into the field next to it. Any overrides you set are passed with every subsequent query run in that session — the toolbar shows a badge counting how many overrides are currently active.
This is useful for testing how a query behaves under different memory limits, thread counts, or join algorithms without modifying any server configuration. Common use cases include setting max_memory_usage to simulate a constrained environment, switching join_algorithm from hash to partial merge, or enabling allow_experimental_analyzer for testing.
Overrides are cleared when you reload the page or click the clear button in the settings panel.
Point-in-Time Recovery & Backup Methods
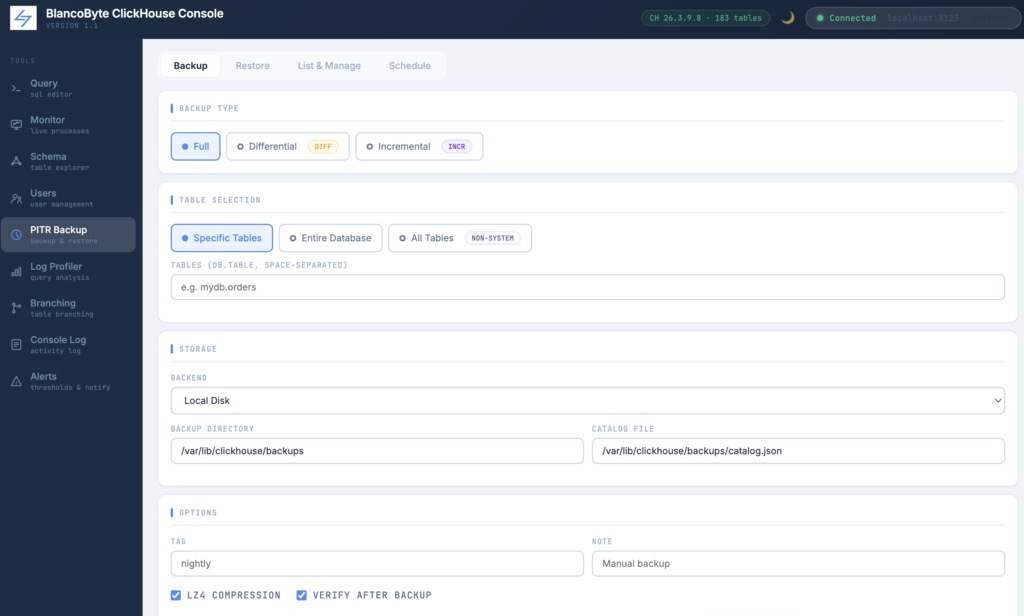
Backup types. You can take three kinds of backups:
- Full — a complete snapshot of every selected table.
- Differential — captures only what changed since the last full backup. Restore requires: the full backup plus this one differential.
- Incremental — captures only what changed since the previous backup of any type. Smaller files, but restore requires the full chain.
For storage, four backends are supported: local disk, AWS S3 and S3-compatible stores like MinIO, Google Cloud Storage, and Azure Blob Storage. All credentials are configured in the Backup panel and stored only in memory for the session.
All backup operations stream live output to the terminal at the bottom of the panel, so you can see exactly what’s happening as it happens.
Restore
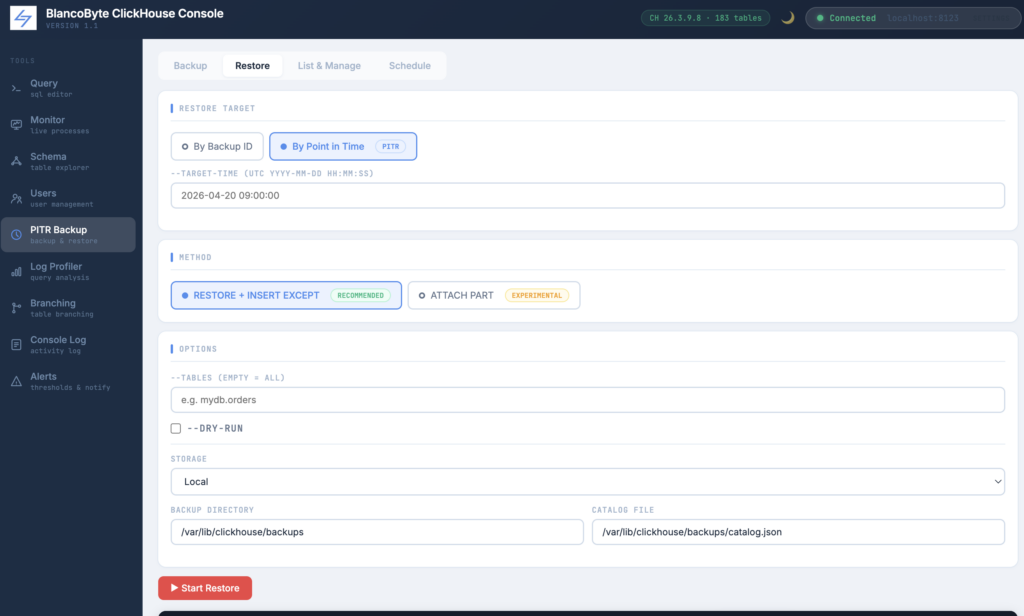
The Restore tab offers two modes. By backup ID: you enter the exact backup ID from your catalog and restore to that snapshot. By point in time: you enter a UTC timestamp and the tool finds the correct backup chain to reconstruct the state of your tables at that moment.
Two restore methods are available. The default uses ClickHouse’s native RESTORE command, which handles everything automatically. The ATTACH PART method is lower-level and experimental — it copies frozen parts directly into the detached directory and attaches them, which can be useful when the standard restore path isn’t available.
A dry run option is available for both modes. Enabling it shows exactly what would happen without making any changes to the database.
List & Manage
The Manage tab reads your backup catalog file and displays all recorded backups in a table: ID, timestamp, type, status, size, and duration. The list can be filtered by status (ok, verified, running, failed) and limited to the most recent N entries.
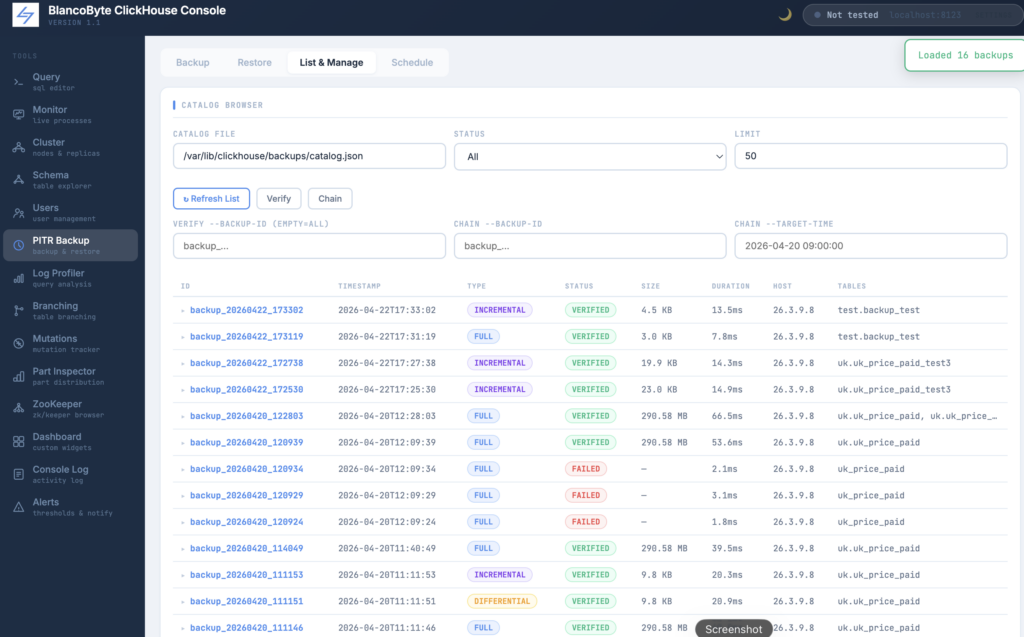
From this tab you can also verify backups — running an integrity check against one specific backup or all of them — and prune old entries based on age or count with a configurable dry run.
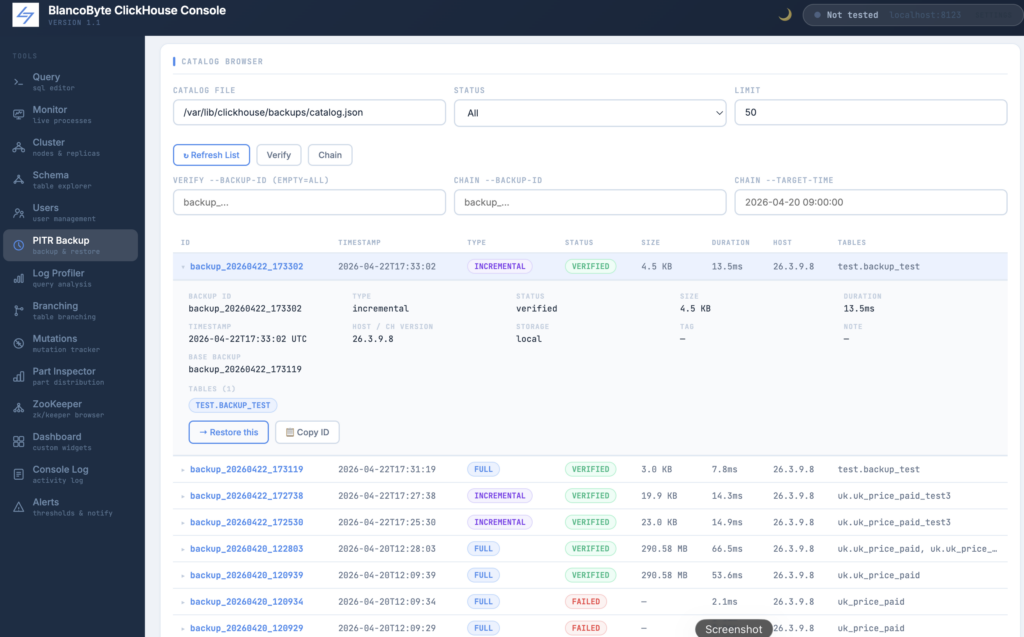
The Chain command traces the complete restore chain for a given backup ID or target time, showing exactly which backups would need to be applied in sequence.
Schedule
The Schedule tab generates a ready-to-paste crontab entry. Set your cron expression, backup type, table selection, storage backend, and tag — the tool produces the complete command with all flags. Copy it into crontab -e and you’re done.
Log Profiler
Slow queries have a way of hiding. The Log Profiler parses your ClickHouse server log and surfaces them.
Two ways to load logs. The Auto-Read tab reads directly from the server. It detects the default log path (/var/log/clickhouse-server/clickhouse-server.log) on startup and shows whether the file exists. Enter the number of lines to tail (default 50,000) and click Load Log File. The Paste Log tab accepts raw log content if you’re working with logs from a remote server or an archived file.
Filters. Before analysis you can narrow the data with any combination of:
- Minimum and maximum query duration (in seconds)
- Username and client host filters
- Regex pattern on the query text
- Time window with ISO-format start and end timestamps
- Flags for errors-only or completed-only queries
- Minimum call count to filter out one-off queries
Sorting. Choose the sort field (Exec Time, Rows Read, Bytes Read, Peak Memory, QPS, or Query Count), the aggregation method (max, sum, avg, min, p95, median), sort direction, and how many top groups to show.
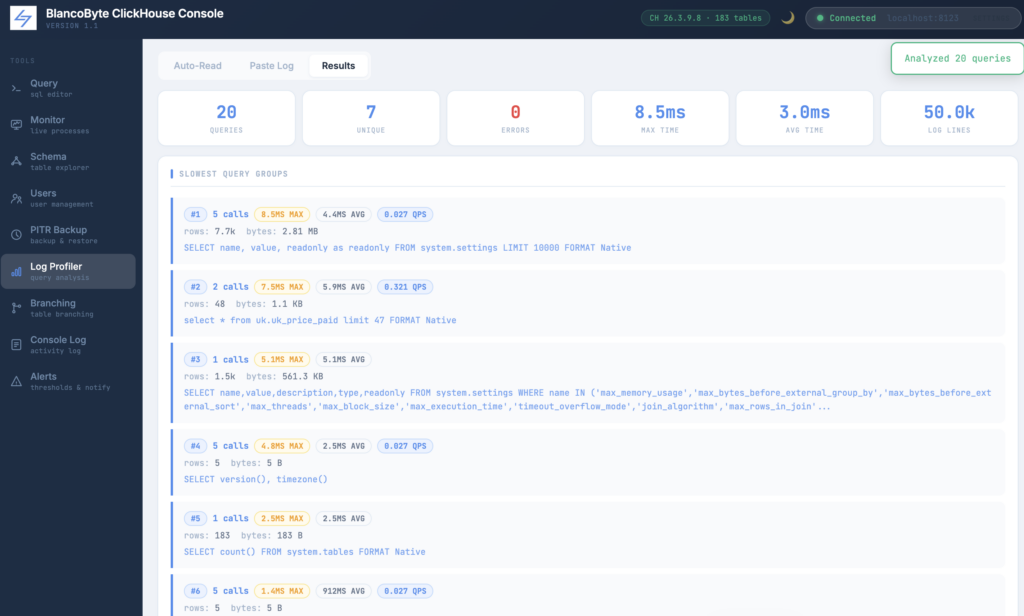
Results. The results tab opens with a summary row: total queries, unique query groups, error count, max execution time, average execution time, and total log lines parsed. Below that, each query group shows call count, max and average duration, QPS, total rows and bytes read, peak memory, and the sample SQL. Error counts appear in red when present.
Export. From the results tab you can export the full analysis in five formats:
- HTML — opens in a new browser tab as a formatted interactive report
- JSON — machine-readable, suitable for further processing
- CSV — for spreadsheet analysis
- Text — plain-text report
- Markdown — for documentation or team wikis
All exports apply the current filter and sort settings.
Branching
The Branching tool creates a read-safe copy of any ClickHouse table without touching the original. It is useful for testing schema migrations, experimenting with queries that modify data, or handing a fixed snapshot to a colleague.
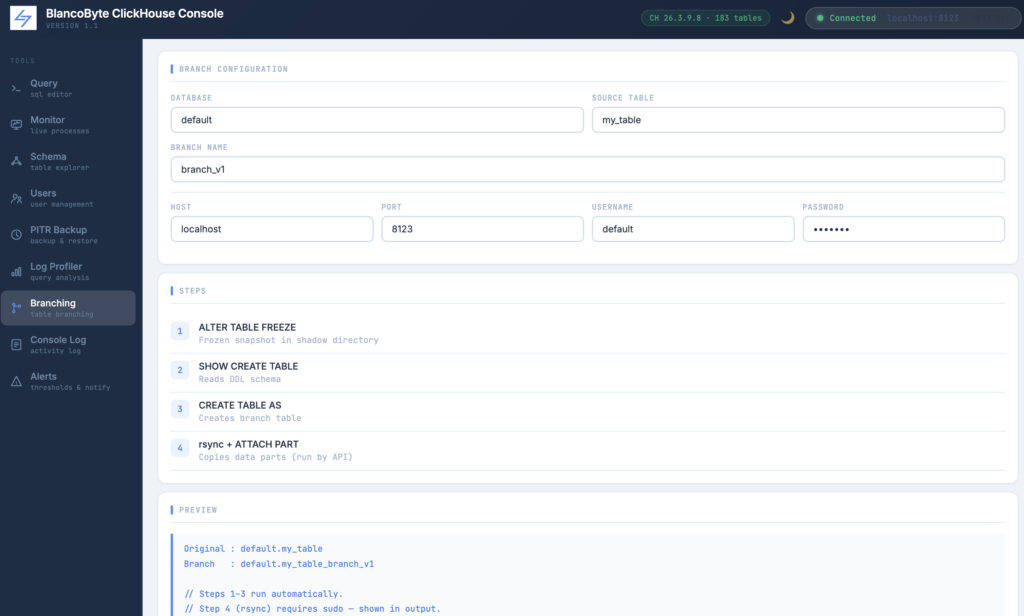
The process has four steps:
- ALTER TABLE FREEZE — ClickHouse takes an instant frozen snapshot and writes the data parts to a shadow directory. No data is copied yet; it uses hard links, so this is effectively instant even for large tables.
- SHOW CREATE TABLE — the DDL schema is read from ClickHouse.
- CREATE TABLE AS — a new table with the branch name is created using the same schema.
- rsync + ATTACH PART — the frozen parts are linked into the new table’s detached directory and then attached.
Steps 1–3 run automatically through the API. Step 4 requires sudo because it involves the ClickHouse data directory, so the exact rsync and attach commands are printed in the output terminal for you to run manually. The Preview panel updates live as you type the database, table, and branch name, showing you both the original and the branch path before you commit.
A Drop button removes the branch table and shows the command to clean the corresponding shadow directory.
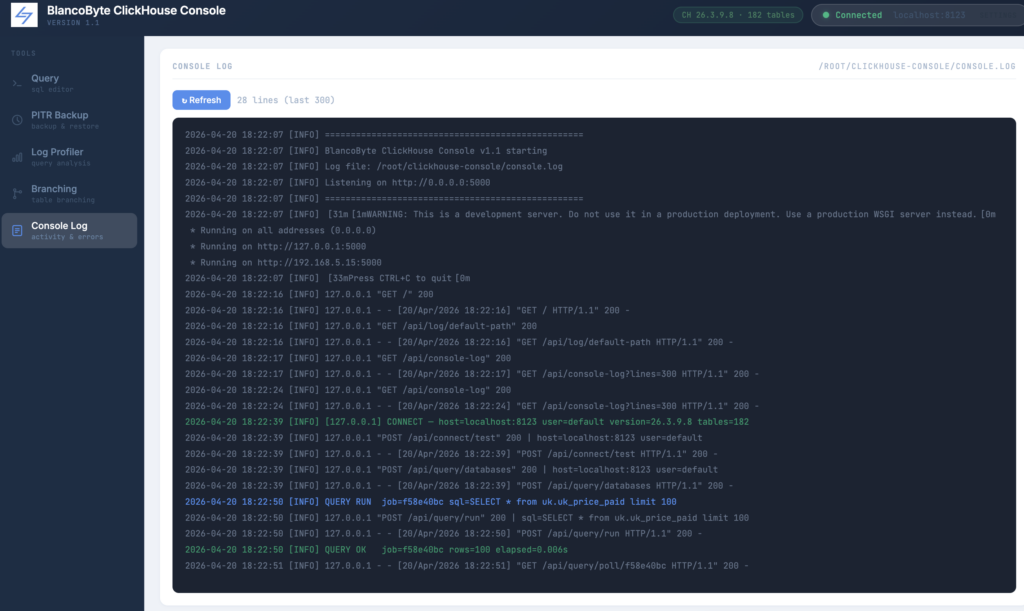
Consol Log
Every operation the console performs — connections, queries, backups, branch creations, profiler runs — gets written to a persistent console.log file on disk. The log captures timestamps, IP addresses, job IDs, SQL previews, exit codes, and error messages in a structured format, so you always have a full audit trail of what happened and when. Inside the UI, the Console Log panel loads the last 300 lines on demand, color-coded by severity: green for successful operations, blue for jobs in progress, yellow for warnings, and red for errors. For terminal users, a logtail.sh script ships alongside the server for real-time streaming. Optional logrotate configuration keeps the file from growing unbounded — daily rotation with a 14-day retention window. Whether you’re debugging a failed backup at midnight or reviewing what queries ran against production last week, the answer is always one click away.
Dark / Light Theme
The console now has full dark mode support. Clicking the 🌙 button in the top-right corner switches between dark and light themes, and your preference is saved in the browser so it persists across page reloads. The color system is built on CSS variables, meaning the entire interface — editor, result tables, sidebar, and all panels — switches themes consistently. The SQL editor’s syntax highlighting is also tied to the theme: Dracula in dark mode, the default CodeMirror theme in light mode.
Dictionary Management
ClickHouse dictionaries are external lookup tables that are loaded into memory and used to enrich query results without joins. They are widely used in production but historically difficult to inspect — you either run a raw system.dictionaries query or look at server logs. The Dictionaries panel gives you a live view of every dictionary: name, status (LOADED, FAILED, LOADING), type, source, element count, memory size, and last successful update time. A per-dictionary Reload button sends SYSTEM RELOAD DICTIONARY for that specific entry, and a Reload All button reloads everything at once. Failed dictionaries are highlighted in red so they are immediately visible without filtering.
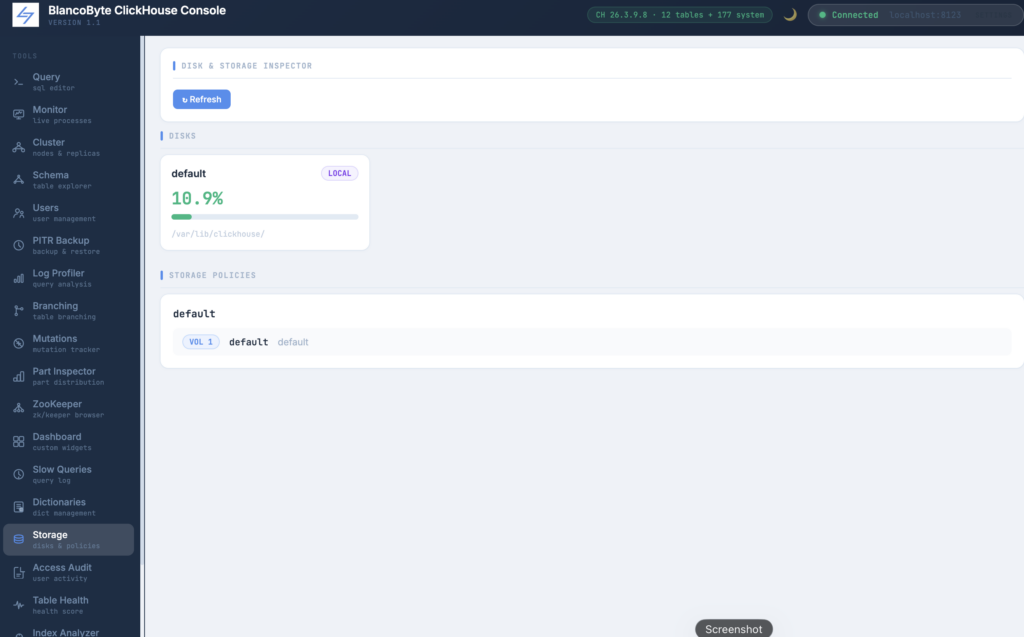
Disk and Storage Inspector
ClickHouse’s tiered storage model — local NVMe for hot data, object storage for cold data, multiple volumes per policy — is powerful but the disk state is normally only visible through raw system table queries. The Storage panel visualizes this in two sections. The top section shows each disk as a card with a fill percentage, color-coded progress bar, used and free space, and the filesystem path. The bottom section shows storage policies as a tree of volumes and disks, including which tables are using each policy and how much data they hold. This is particularly useful when a node is running low on space and you need to quickly understand which policy is consuming what, or when verifying that tiered storage is configured the way you expect.
SQL Syntax Highlighting (CodeMirror)
The plain textarea in the Query panel has been replaced with a CodeMirror-based editor. Keywords, table and column names, string literals, and numbers are now color-coded. Line numbers are displayed, Ctrl+Enter runs the query, and Ctrl+/ toggles comment lines. The editor is also multi-statement aware — if you have multiple queries separated by semicolons, it detects which statement your cursor is in and runs only that one, without needing to manually select text.
Access Control Audit
The audit panel reads from system.query_log and produces a structured activity report per user. The time window is configurable from one hour to seven days, and a user filter narrows the query server-side so you can focus on a specific account without loading the entire history. The By User tab shows query count, error rate, total and maximum execution time, data read, and memory usage per user, with a Detail button that loads that user’s last fifty queries individually — timestamps, durations, data volumes, and any exception messages. The Query Types tab breaks down each user’s activity into SELECT, INSERT, ALTER, DROP, CREATE, and SYSTEM commands, which is useful for detecting unexpected DDL activity. The panel also writes to a log file on the server: clicking “Run and Save to Log” appends a structured plaintext summary to the configured path, and the current file size is shown in the control bar so you can see how much history has accumulated.
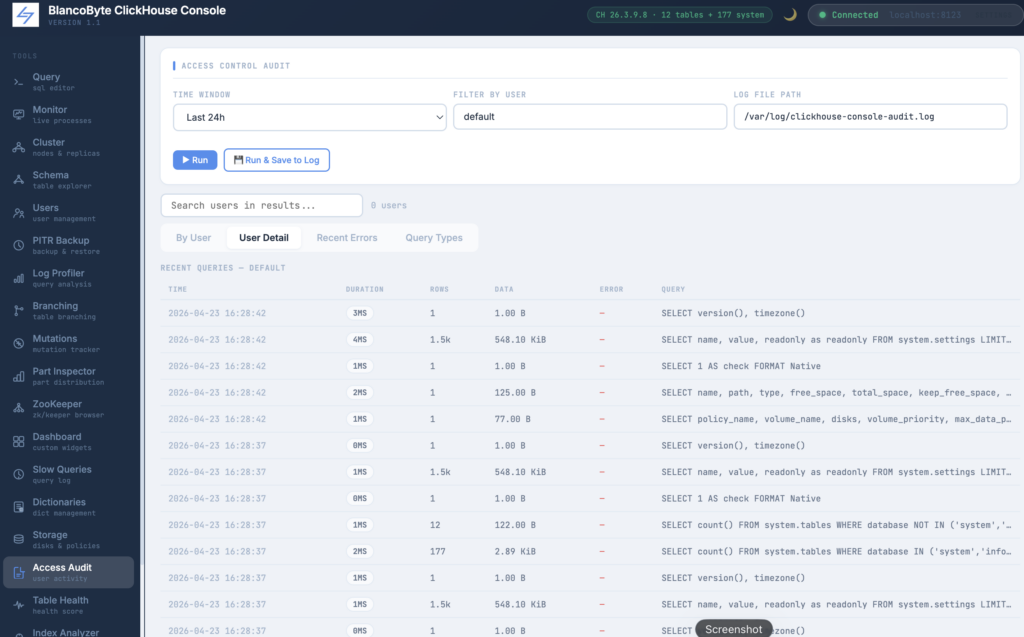
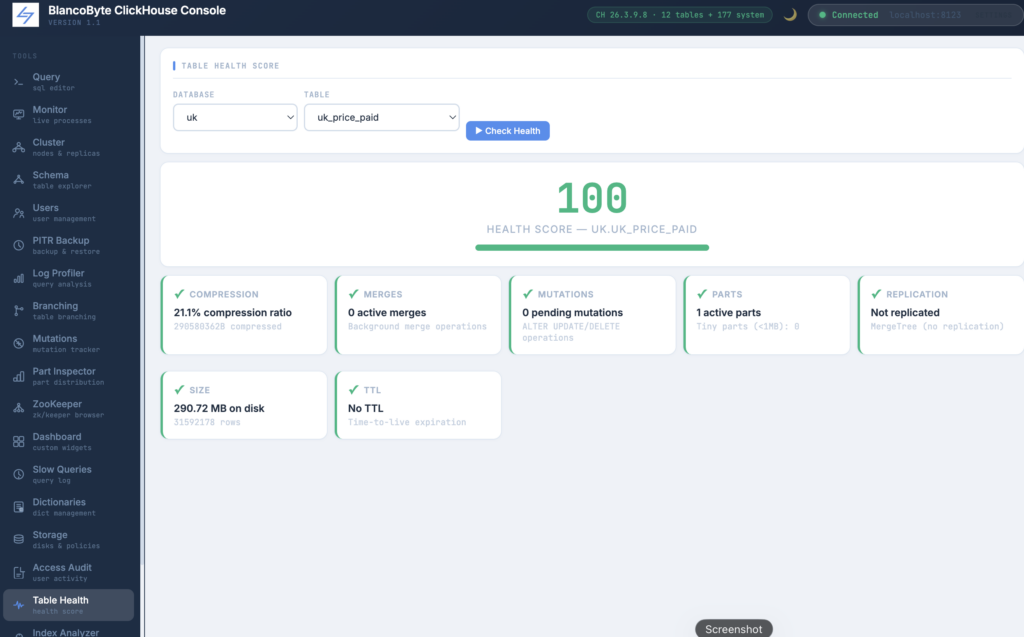
Table Health Score
The health panel runs six diagnostic checks against a table and produces a 0–100 score. The checks are: active part count (high part counts indicate merge pressure or too-frequent small inserts), compression ratio (a ratio above 80% suggests the data is not compressing well), active background merge count, replication delay in seconds (for replicated tables), pending mutation count, and whether TTL is configured. Each check is displayed as an individual card with a colored left border — green, yellow, or red — and the overall score drives a color-coded progress bar at the top. The scoring is weighted so that a single bad check cannot push the score to zero, but multiple warnings compound. The goal is to give a quick answer to “is this table healthy” without running six separate queries manually.
EXPLAIN (On Demand)
A dedicated EXPLAIN button now lives right next to the Run button in the toolbar. It was a deliberate choice to keep EXPLAIN separate from query execution — clicking Run never triggers an explain automatically. You choose when you want it. There are three modes available via a dropdown: Plan (the default, shows the logical query plan), Pipeline (shows the execution pipeline with threading information), and Estimate (shows estimated row counts and cost). The output appears inline below the editor so you can read the plan and edit the query in the same view.
Query Export
Query results can now be downloaded directly from the toolbar with the Export button. Three formats are supported: CSV for spreadsheets and data tools, JSON for APIs and scripting, and TSV as a tab-separated alternative. The export happens entirely in the browser — no round-trip to the server, no temporary files. The button is disabled until a query has returned results, so there’s no ambiguity about what gets downloaded.
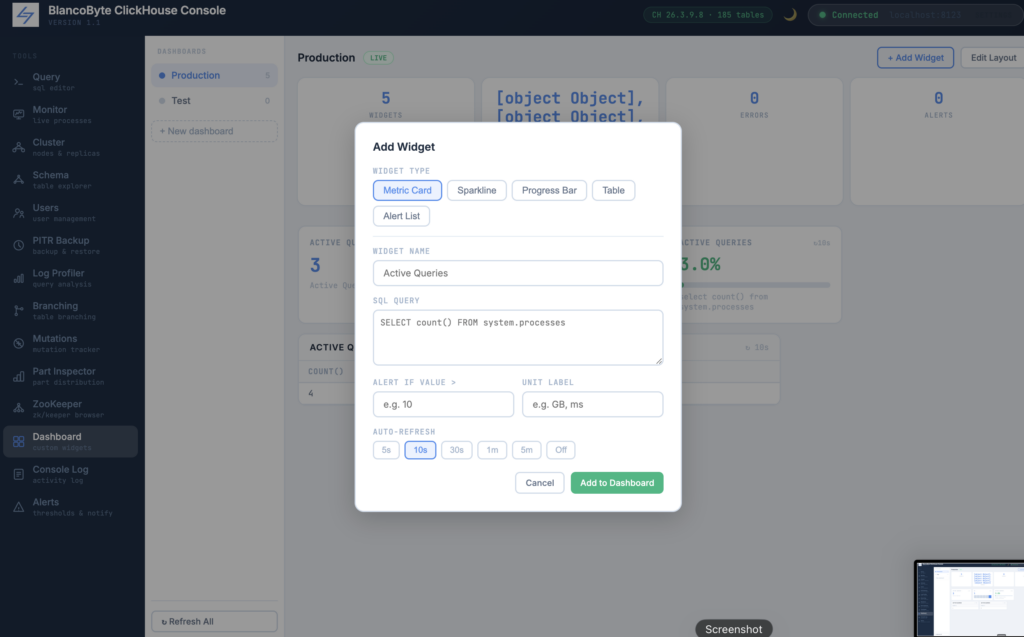
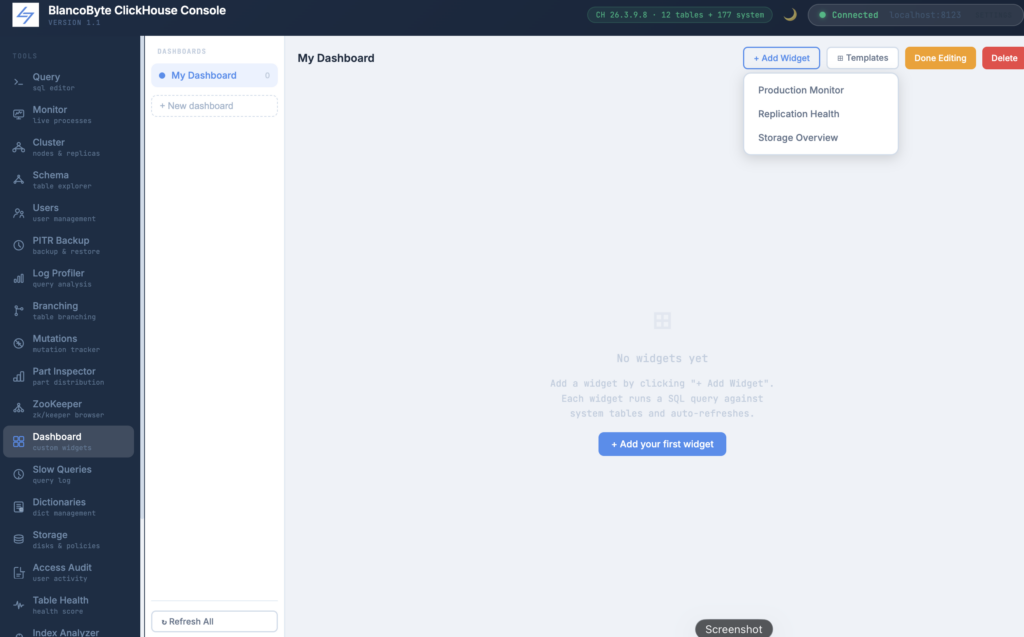
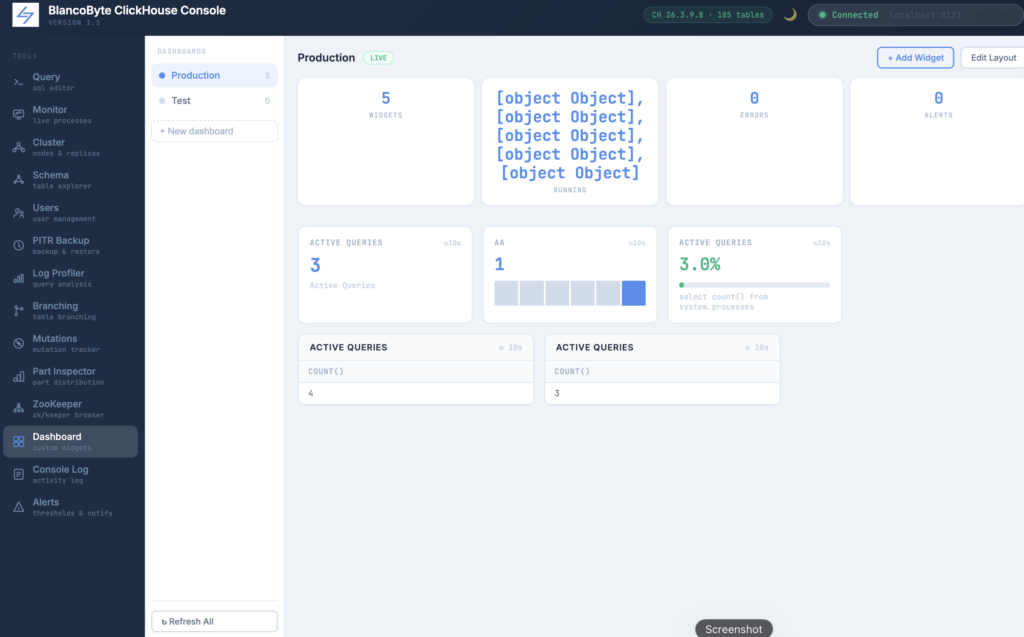
Dashboard Builder
Every team running ClickHouse in production has a handful of queries they run constantly — active queries, replication delay, disk usage, stuck mutations. The Dashboard Builder turns those into a persistent, auto-refreshing monitoring view built entirely from SQL. Each widget is a query: write the SQL, pick a display type (metric card, sparkline, progress bar, table), set a refresh interval, and optionally define an alert threshold. Widgets refresh independently and stop polling when you navigate away. Dashboards are saved to the browser’s local storage, so your layout survives page reloads without any server-side configuration. You can create multiple named dashboards and switch between them from the sidebar.
Saved Favorites
Any query can be saved as a named favorite with the ⭐ button. Favorites are stored in the browser’s local storage and appear in a collapsible panel on the right side of the Query view. Clicking a favorite loads it instantly into the editor. Each entry can be individually deleted. This is particularly useful for queries you run repeatedly — monitoring checks, row count snapshots, or common debugging queries — without having to retype or dig through history every time.
Saved Connections
Connection profiles can now be saved by name. After filling in host, port, username, and database, clicking Save stores the profile locally. A dropdown in the header lists all saved connections — clicking one connects immediately without re-entering credentials. The password is intentionally not saved as part of the profile. Up to ten profiles can be stored, and individual profiles or the entire list can be cleared from the dropdown.
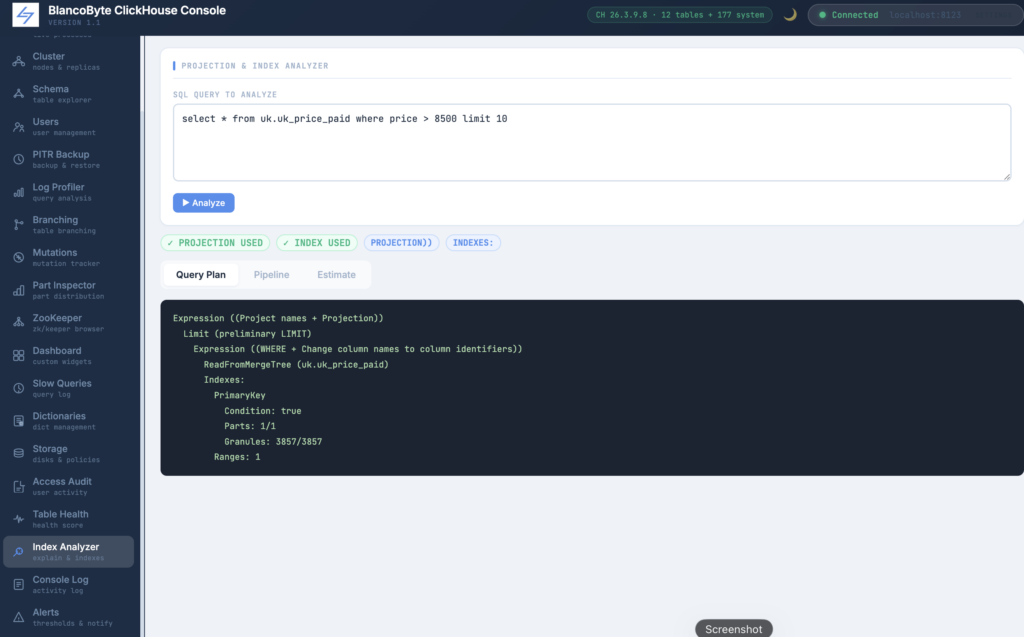
Projection and Index Analyzer
When a query runs slowly, the first question is whether ClickHouse is using the primary index, any data skipping indexes, or any projections. The answer is in EXPLAIN output, but raw EXPLAIN text requires some practice to read. The analyzer runs three EXPLAIN variants — PLAN with index and projection details, PIPELINE showing the execution graph, and ESTIMATE showing the expected rows and marks to read — and displays each in a separate tab with monospace formatting. Above the tabs, two badges indicate immediately whether a projection was used and whether index skipping fired. If neither badge is green, the query is likely doing a full scan, which is the starting point for optimization: you either add an index, define a projection, or rethink the query structure.
Monitor Panel
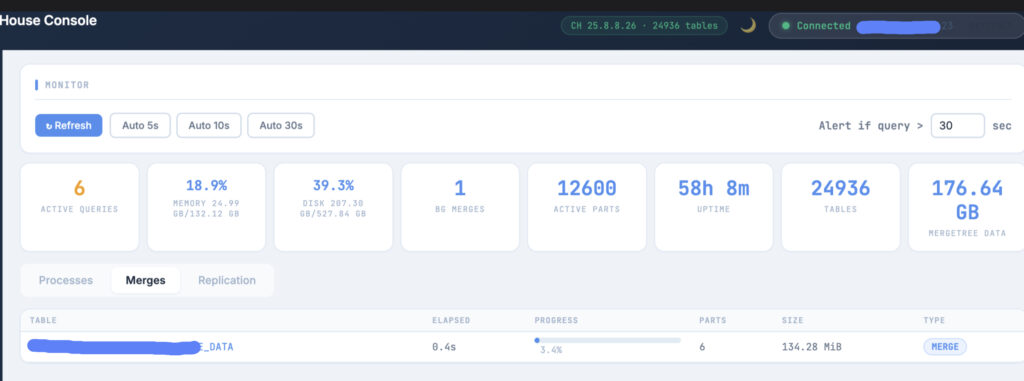
The Monitor panel gives you a live view of what ClickHouse is doing right now.
At the top is a metrics dashboard that reads from system.metrics and system.asynchronous_metrics: memory usage as a percentage of total RAM, disk utilization, number of active queries, background merge tasks, total active parts, uptime, total number of tables, and total MergeTree data size.
Below the dashboard, three tabs break down the details:
Processes shows every currently running query with its user, elapsed time, rows read, and memory usage. Each row has a Kill button that sends a KILL QUERY signal to ClickHouse.
Merges shows every active merge operation with its table, elapsed time, a progress bar, part count, and whether it’s a merge or a mutation.
Replication shows the replication queue — how many entries are pending, which are currently executing, how many retries have been attempted, and any exception messages.
Auto-refresh is available at 5, 10, or 30-second intervals. A configurable alert threshold highlights queries that have been running longer than a set number of seconds with a badge on the sidebar navigation item.
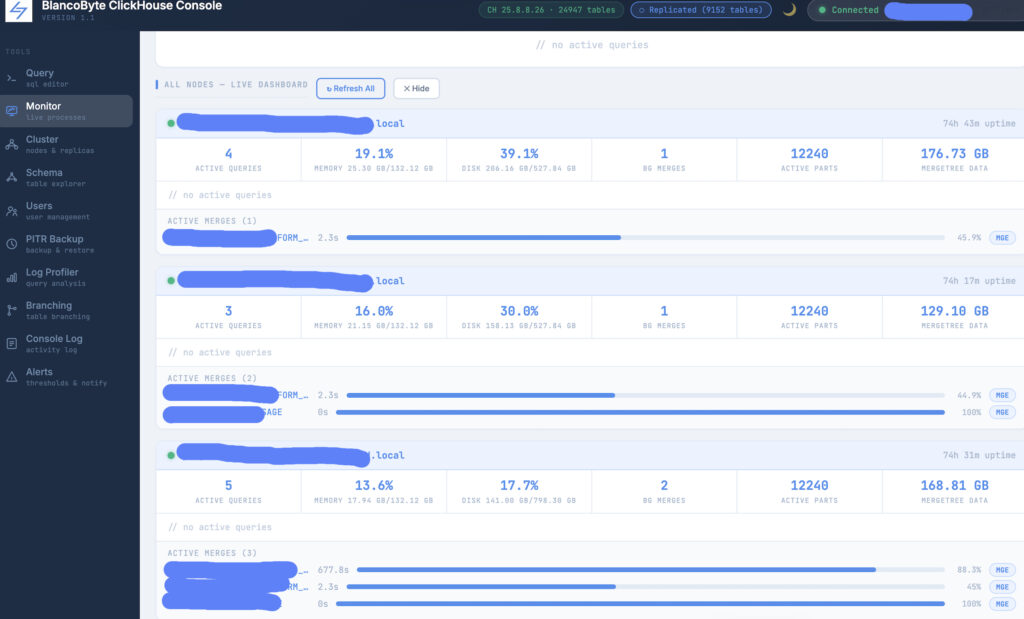
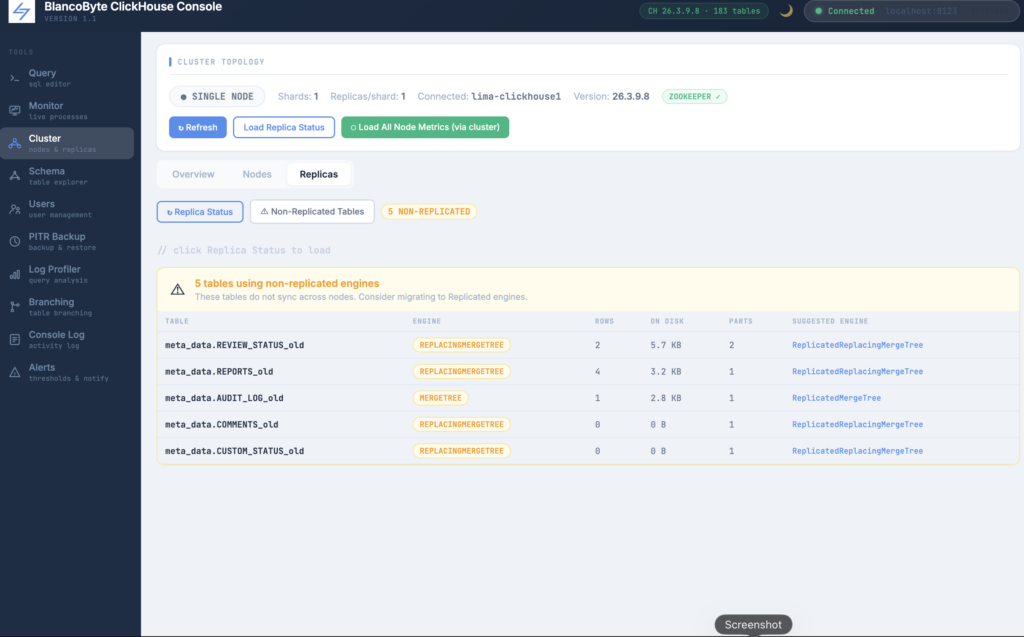
Cluster Awareness
From the moment you connect, the console reads system.clusters and system.replicas to understand your topology. Whether you’re running a single node, a replicated setup, or a sharded cluster with multiple replicas per shard, it detects the configuration automatically and shows it as a badge in the header — so you always know what you’re looking at. The Cluster panel breaks this down further: an Overview tab maps out every shard and replica, showing which node you’re currently connected to; a Nodes tab loads live metrics for each node in the cluster; and a Replicas tab surfaces the full system.replicas table — leader status, readonly flags, replication delay in seconds, queue depth, and active replica count per table.
The more interesting problem we solved here is that in most production environments, the console server can only reach one ClickHouse node directly. The other nodes are on internal hostnames that aren’t resolvable from outside the cluster. Rather than requiring you to open ports or configure network access for every node, the console uses ClickHouse’s clusterAllReplicas() function to route requests through the node you’re already connected to. Clicking “All Nodes” in the Monitor panel fires a single query against clusterAllReplicas('your_cluster', system.processes) — and ClickHouse does the work of collecting responses from every node internally. The result is a live per-node dashboard showing active queries, memory and disk utilization, background merges, active parts, and MergeTree data size for every node in the cluster simultaneously, without any additional network configuration on your end.
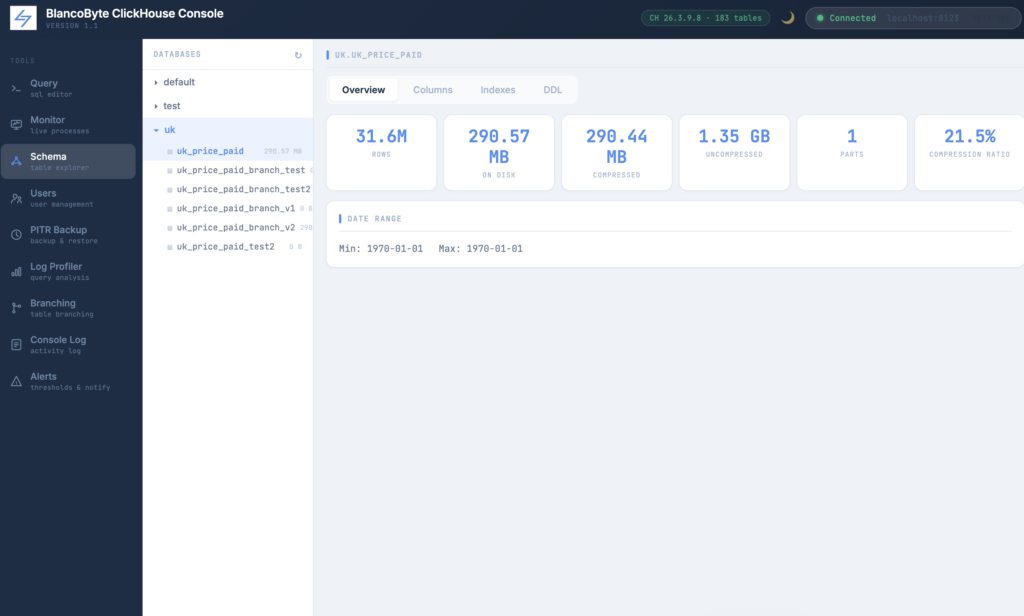
Schema Explorer
The Schema Explorer panel replaces the basic table dropdown in the Query view with a dedicated inspection interface. Databases and tables are listed in a tree on the left; clicking a table opens a detail view on the right with four tabs. The Overview tab shows row count, disk usage, compressed and uncompressed sizes, active part count, and the date range of the data. The Columns tab lists every column with its type, default expression, compression codec, and flags indicating whether it participates in the primary key, sorting key, or partition key. The Indexes tab shows any data skipping indexes defined on the table. The DDL tab displays the full CREATE TABLE statement with a one-click copy button.
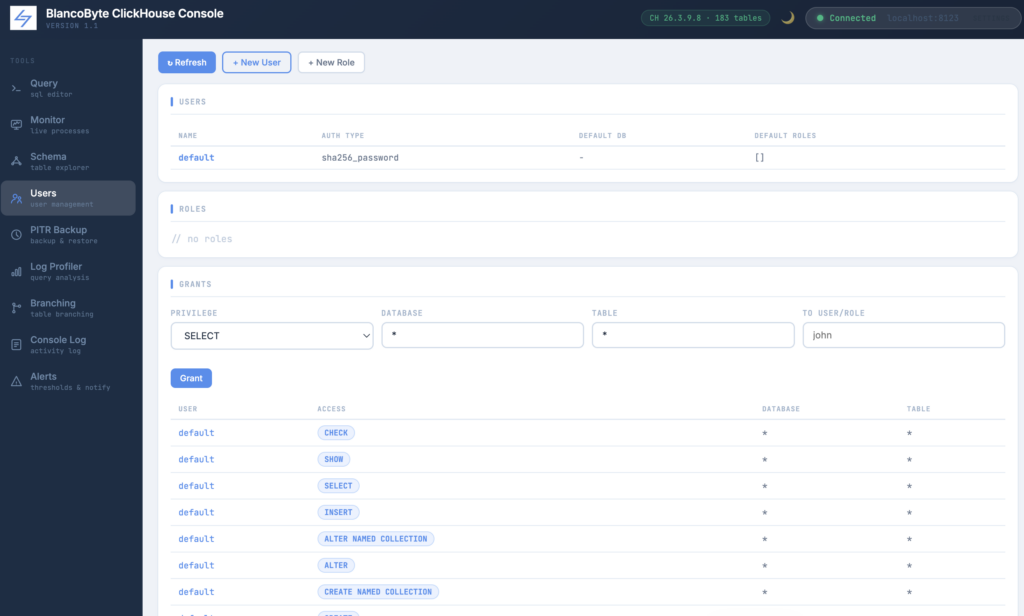
User Management
The Users panel exposes ClickHouse’s access control system directly in the UI.
The Users section lists all users with their authentication type, default database, and assigned roles. New users can be created with a name, password, optional host restriction, optional default database, and an optional role to grant immediately on creation. Any user other than default can be dropped with a confirmation prompt.
The Roles section shows all defined roles. New roles can be created with a name and a comma-separated list of initial privileges.
The Grants section shows all current grants and includes a form to grant any privilege (SELECT, INSERT, ALTER, CREATE, DROP, ALL PRIVILEGES, etc.) on any database and table combination to any user or role.
Standalone Terminal Tools
Two standalone Python scripts were added for use outside the web UI. ch_monitor.py is a terminal-based monitor that prints active queries, system metrics, the merge queue, and the replication queue. It supports auto-refresh with a configurable interval, an alert threshold for long-running queries, and a --kill flag to send a kill signal to a specific query by ID. ch_schema.py is a schema exploration tool with subcommands: databases lists all databases, tables <db> lists tables with sizes, columns <db> <table> shows column details, ddl <db> <table> prints the full CREATE statement, top lists the largest tables cluster-wide, and find <pattern> searches table names. Both tools use rich for formatted terminal output when available, and fall back to plain text otherwise.
Query Formatter
Writing SQL by hand in a single editor line tends to accumulate fast — a subquery here, a few more JOINs there, and suddenly you’re reading something that takes real effort to parse. The formatter button in the Query panel rewrites the active SQL in place: every major clause starts on its own line, AND and OR conditions are indented under their WHERE or HAVING block, column lists break at commas, and all keywords are uppercased consistently. It works entirely in the browser with no server round-trip, so it’s instant regardless of the query length. Selecting text before clicking Format applies the formatter only to the selection, which is useful when you have a scratchpad with multiple queries you don’t want to rewrite all at once.
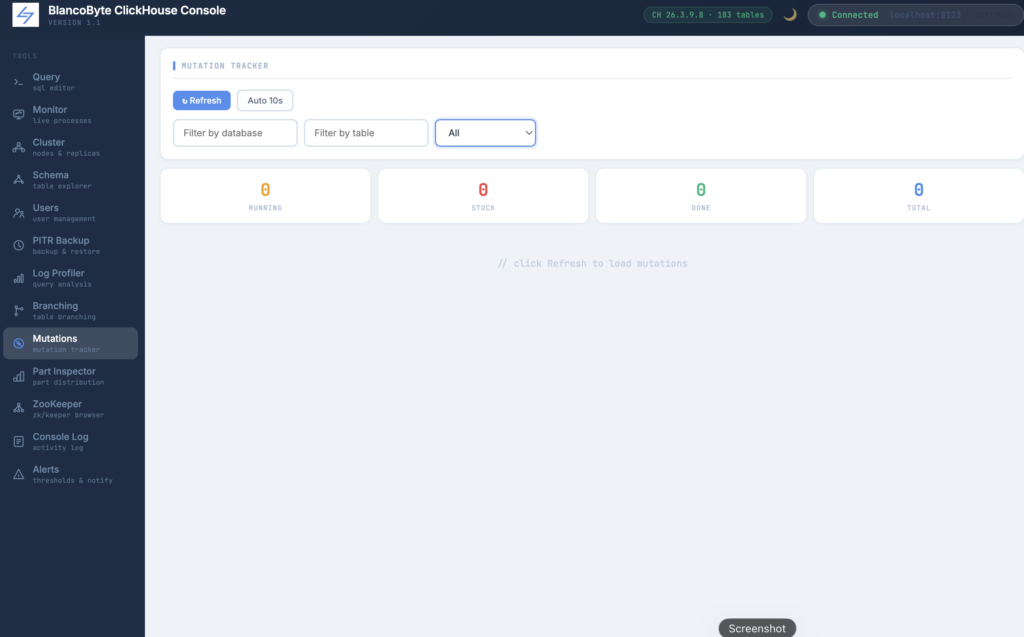
Mutation Tracker
ClickHouse mutations — ALTER TABLE UPDATE, ALTER TABLE DELETE, and MATERIALIZE — are background operations that rewrite data parts. They’re necessary but they’re also one of the more opaque parts of running ClickHouse in production: you issue the command, ClickHouse acknowledges it, and then the actual work happens asynchronously across potentially thousands of parts with no obvious progress indicator in the default interface. The Mutation Tracker panel reads system.mutations and shows every mutation’s progress as a parts-done-to-parts-remaining ratio with a visual progress bar. Mutations that have encountered errors are flagged separately as Stuck, with the failure reason visible on hover. A Kill button sends KILL MUTATION for any running or stuck mutation. The panel also supports filtering by database and table if you have a large number of active mutations, and an auto-refresh option keeps it live while you wait for a long-running operation to complete.
Part Inspector
Every MergeTree table in ClickHouse is physically stored as a collection of parts, and understanding how those parts are distributed across partitions is often the first step in diagnosing slow queries, unexpected disk usage, or merge pressure. The Part Inspector panel provides a structured view of system.parts organized by partition. For each partition you get the part count, row count, on-disk size, compressed and uncompressed byte totals, compression ratio as a progress bar, date range, frozen part count, and last modification time — all in a single table. Clicking a partition row expands a detail view showing every individual part within it: type (Wide or Compact), row count, compressed size, mark count, active status, frozen status, and TTL boundaries if defined. The left panel mirrors the schema tree from the Schema Explorer, so navigating to any table is just two clicks. This is particularly useful for verifying that partition pruning is working as expected, identifying partitions with abnormally high part counts that may indicate merge pressure, and auditing frozen parts before running a branch or backup operation.
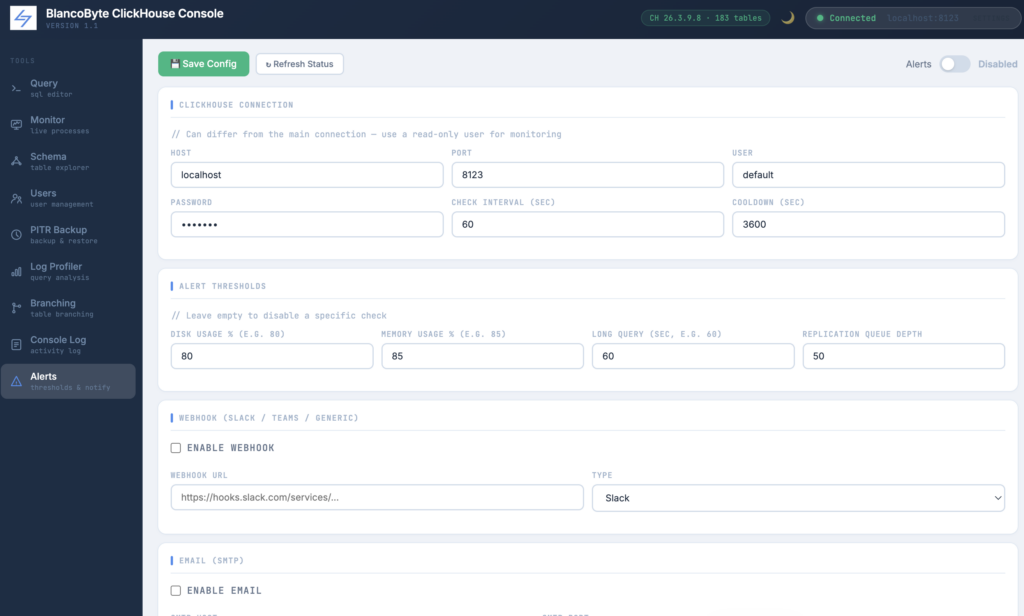
Alerts & Notifications
The Alerts panel lets you configure threshold-based monitoring with outbound notifications to Slack, Microsoft Teams, or any webhook-compatible system, as well as email via SMTP.
You configure which ClickHouse instance to monitor (this can be a separate read-only user from your main connection), how often to check, and a cooldown period to prevent alert spam.
Four thresholds are available out of the box: disk usage percentage, memory usage percentage, long-running query duration in seconds, and replication queue depth. Leaving a threshold field empty disables that specific check.
When a threshold is exceeded, the console fires the configured channels — webhook, email, or both — and records the event in the alert history visible at the top of the panel. Each alert entry shows its severity, title, message, and timestamp.
Two channel types are supported. Webhook accepts a URL and supports Slack’s incoming webhook format, Microsoft Teams’ MessageCard format, and a generic JSON payload for anything else. A test button sends an immediate test message to verify the configuration. Email uses SMTP with optional STARTTLS, supporting any SMTP provider including Gmail, SendGrid relay, or your own mail server.
Configuration is saved to alert_config.json in the application directory and persists across restarts.
Running it
Run ./install.sh once to create a virtual environment and install dependencies, then start it with ./run.sh. The server listens on port 5000.
unzip clickhouse-console.zip
cd clickhouse-console
./install.sh
./run.sh
# → http://localhost:5000
A note on design
Every part of this console is built for people who run ClickHouse seriously. The design decisions reflect that.
Operations stream their output live so you’re never waiting on a black box. Backups, restores, and branch operations show you every step in real time. The query editor is multi-statement aware because real SQL workloads always have more than one query open at a time. EXPLAIN is a deliberate action, not something that fires automatically and interrupts your flow. The schema explorer, user management, and monitoring panels exist because context-switching to the CLI for routine inspection is friction that accumulates.
The whole thing runs on your own infrastructure. No accounts, no cloud dependency, no telemetry. Just a Python process sitting next to your ClickHouse instance.
BlancoByte ClickHouse Console is part of our growing open tooling for data infrastructure. If you are running ClickHouse in production and managing it through a mix of terminal scripts and manual commands, it might be worth a look.
— The BlancoByte Team


