


We shipped BlancoByte ClickHouse Console v1 — a single-process Flask tool you ran next to your ClickHouse instance. It did the job for a one-person operator on a one-cluster setup. v4 is the rebuild. Multi-user, role-based, audited, multi-cluster, with a hardened deployment, a credential vault, LDAP/AD authentication, SIEM forwarding, and native ClickHouse backup with scheduling. Almost every panel from v1 has been touched. Many are new.
This is a tour of everything in v4 — both what’s new and what changed.
Foundation
v1 kept everything in memory. v4 has a proper persistence model: Postgres for state (12 tables — users, audit, query history, favorites, dashboards, encrypted credentials, LDAP and SIEM config, backup schedules), Redis for sessions, gunicorn workers behind Nginx, all managed by systemd. An installer brings it up in one pass with a TLS certificate and a hardened service user.
Credential Vault
ClickHouse passwords, LDAP bind credentials, SIEM auth headers — all encrypted at rest with a master key sourced from the environment. The database alone is not enough to read them back.
Multi-User Login
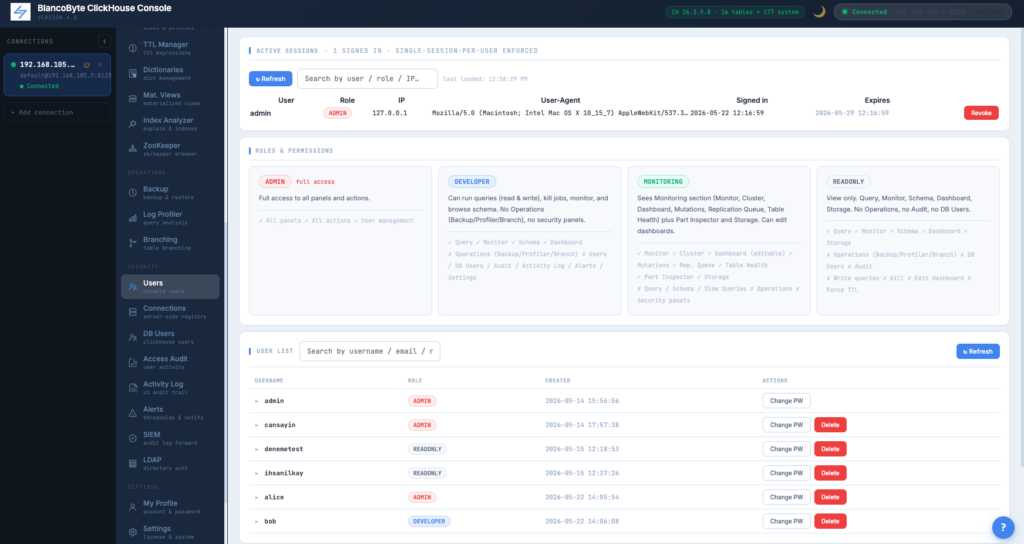
The console is now a multi-user product. Local accounts with username/password, sessions tracked in Redis, every login attempt audited with source IP.
Role-Based Access Control
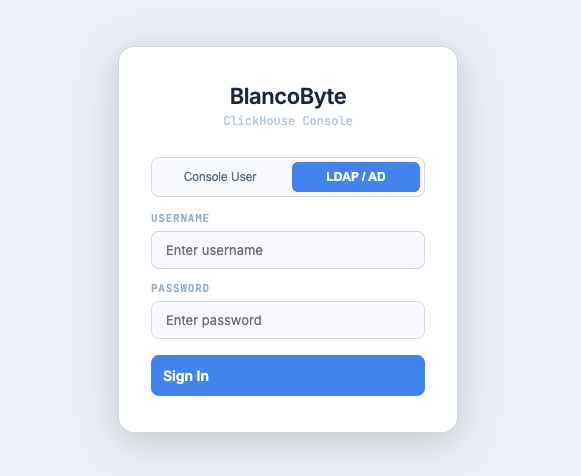
Four built-in roles: admin (everything), developer (queries, schema, branching), monitoring (read-only health and metrics), readonly (allow-listed queries only). Every route is RBAC-gated server-side.
LDAP / Active Directory
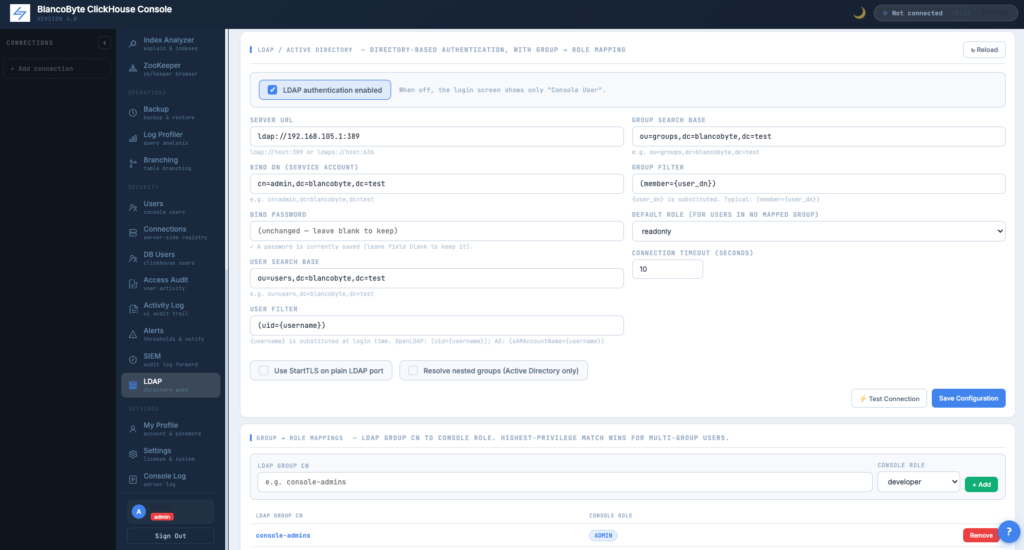
Hybrid auth alongside local accounts. The login screen shows a pill switcher (Console User / LDAP / AD) when LDAP is enabled. Configuration covers LDAPS, StartTLS, AD’s nested-group OID for transitive memberships, and a structured per-step test button.
LDAP Group → Role Mapping
Directory groups translate into console roles automatically. Drop a user into “console-admins” in AD and they’re an admin on next login — no manual provisioning step.
User Management Panel
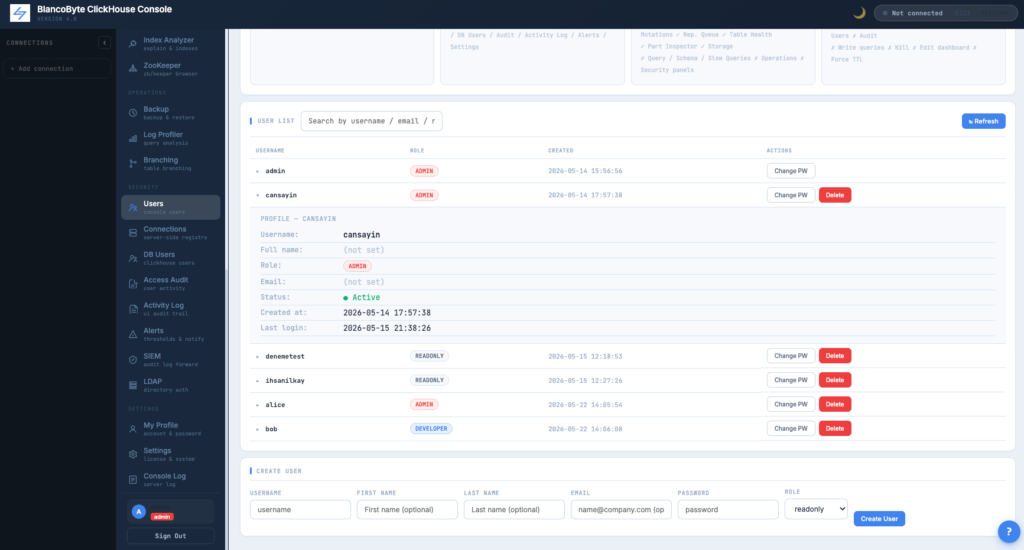
Create, disable, reset password, change role — all from an admin-only panel. Local and LDAP-provisioned accounts are visibly distinguished by auth source.
Audit Trail
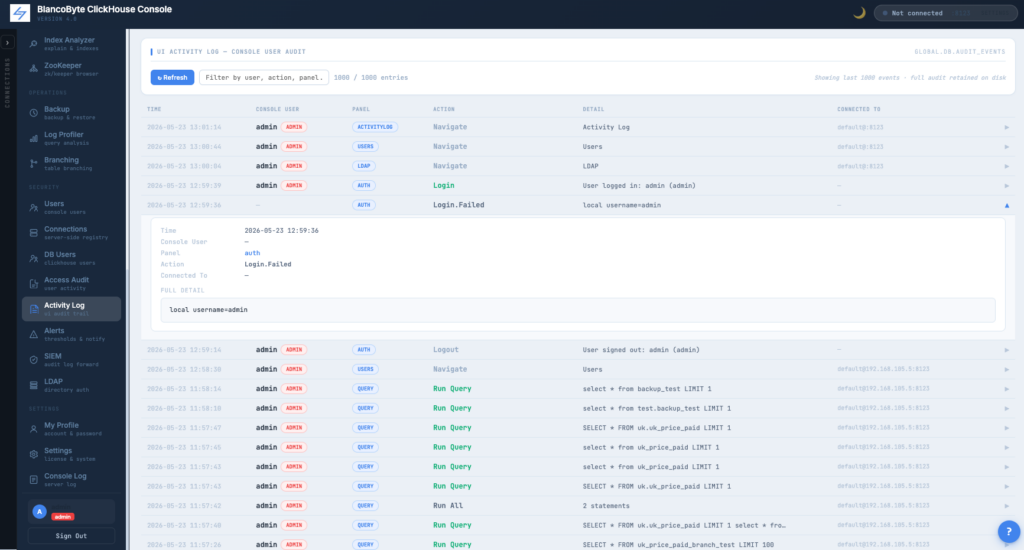
Every action is recorded — logins, queries, connection edits, backups, restores, schedule changes, cancellations. Append-only. Records user identity, role, source IP, action, panel, structured detail, connection used, and result.
Audit Log Browser
Filter by free-text search, action, panel, user, date range, result. Export the filtered view as CSV or JSON.
SIEM Forwarding
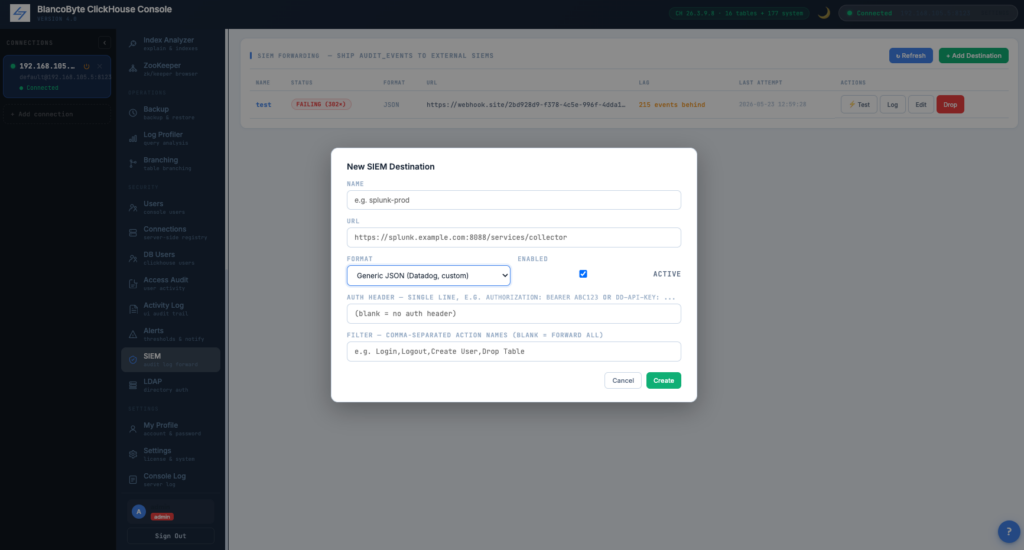
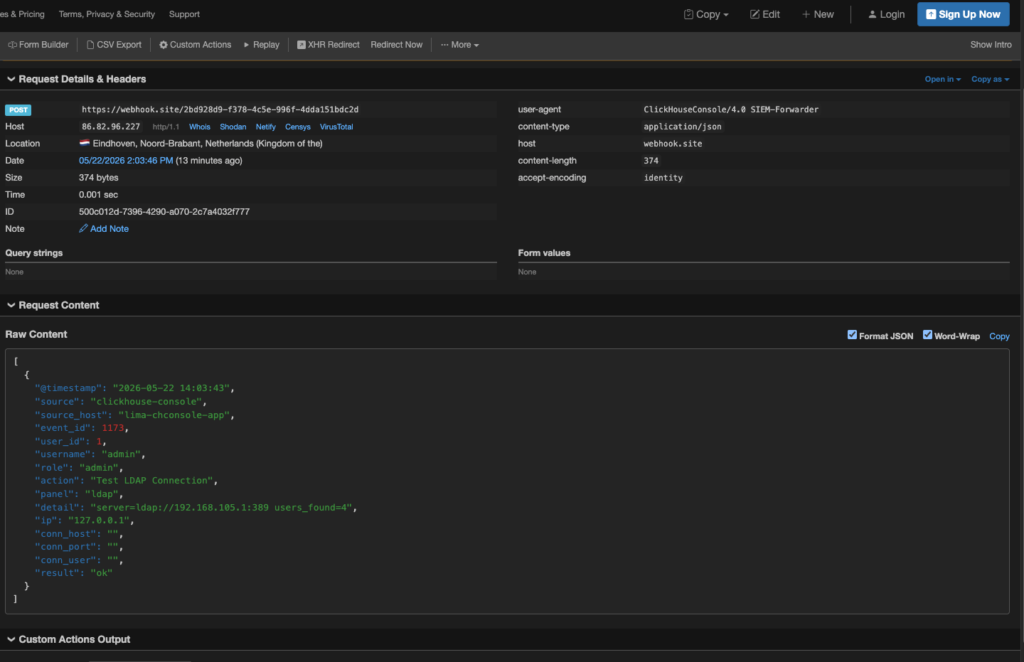
Forward every audit event in real time to Splunk HEC, Datadog Logs, Elasticsearch bulk, Slack webhook, or a generic JSON webhook. Background thread batches, tracks high-water mark per destination, applies exponential backoff on failure.
SIEM Destination Configuration
Per-destination: URL, format, optional auth header (masked after save), optional action filter, batch size. A test button sends a single event to verify the configuration.
SIEM Forward Log
Rolling log of the last 200 forward attempts per destination: status, latency, response body on failure. Surfaces broken integrations before they become silent.
You can track your activities on;
| Destination | Best for | Retention | Alerting | Typical customer |
|---|---|---|---|---|
| Splunk HEC | Enterprise SIEM, compliance archive, deep search | Years (license-dependent) | Built-in alerts, dashboards | Large orgs with an existing Splunk investment |
| Datadog Logs | Unified observability with metrics and APM | 15 days to 18 months | Strong, integrates with PagerDuty | Teams already on Datadog for infra |
| Elasticsearch | Self-hosted log search, Kibana dashboards | Whatever your cluster holds | Via Kibana / ElastAlert | Cost-sensitive teams on their own stack |
| Slack Webhook | Real-time notifications for critical events only | 90 days (Free) / unlimited (Pro) | Channel-based, human-driven | Every team — usually as a second destination |
| JSON Webhook | Custom pipelines: Loki, Lambda → S3, n8n, Kafka | Depends on downstream | Depends on downstream | Teams with bespoke log infrastructure |
Image for an example.
Connection Registry
Server-side saved connection profiles with host, port, username, encrypted password. The header dropdown picks one and the whole console reorients around that cluster.
Multi-Cluster Awareness
Every panel that talks to ClickHouse — Query, Schema, Monitor, Backup, Alerts — routes through the selected connection. No cross-cluster bleed. Backup history from cluster A never appears in cluster B’s view.
Native ClickHouse Backup
v1 shelled out to a Python script and wrote to the application host’s local disk. v4 uses ClickHouse’s built-in BACKUP DATABASE ... TO File(...) directly. The file is written by the ClickHouse server to a path it can see — typically a shared mount — and no row of customer data flows through the application host.
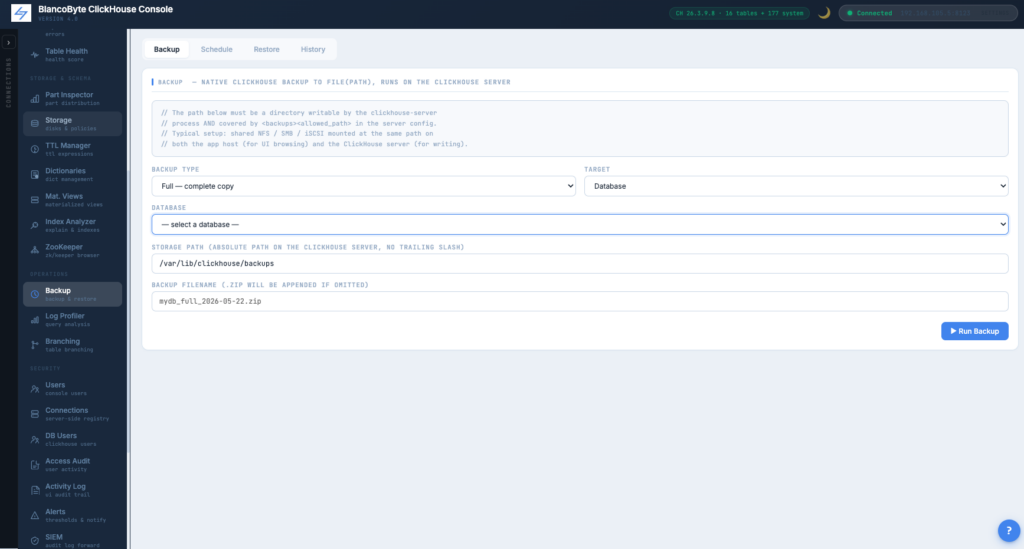
Full / Differential / Incremental
Three backup types. Full is self-contained. Differential builds on the most recent full (discovered server-side via a filename glob). Incremental builds on the most recent backup of any type. Target can be a single database, specific tables, or all user databases.
Scheduled Backups
A cron-driven scheduler inside the application. Schedule rows live in Postgres with name, cron expression, type, target, storage path, filename template. A background thread polls every 30 seconds and fires what’s due.
Filename Templates
Templates support placeholders the scheduler substitutes at fire time: {db}, {type}, {date}, {time}, {datetime}, {ts}. The default {db}_{type}_{datetime}.zip produces readable, sortable, grep-friendly filenames.
Schedule List
Status pills (OK / PAUSED / PENDING / FAILING ×N), type pills (full / diff / incr), inline actions per schedule: Run Now (audited separately from the system-level fire), Pause / Resume, Edit, Drop.
Restore with Rename
By default ClickHouse expects the source database name to match what’s inside the backup. The “Restore under a different name” toggle exposes source and target names separately and emits RESTORE DATABASE src AS dst FROM File(...) — solving the common “Database X not found in backup” confusion.
Backup History
Live view of system.backups, auto-refreshing every four seconds. Every row clickable for full detail: parsed source path, timestamps, duration, file count, all size variants, complete error text.
Cancel In-Flight Backup or Restore
Long-running operations can be cancelled from four places: the result box on the Backup tab, the result box on the Restore tab, inline on each in-flight history row, or the detail modal. KILL is issued server-side; partial files require manual cleanup.
Multi-Database Schema Tree
v1 was accordion-style — opening one database collapsed the previous. v4 supports any number of databases open at once across Query, Schema Explorer, and Part Inspector.
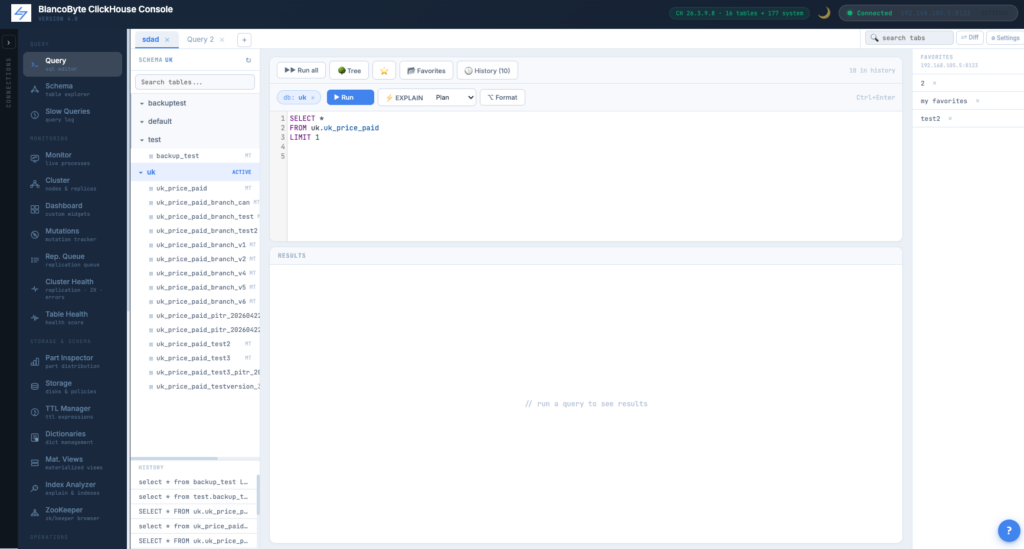
Active Database Context
Click any database or table to make that database active. With “test” active, SELECT * FROM users resolves to test.users without typing the prefix. A pill in the toolbar shows the active context. Cross-database references (other.t) still work.
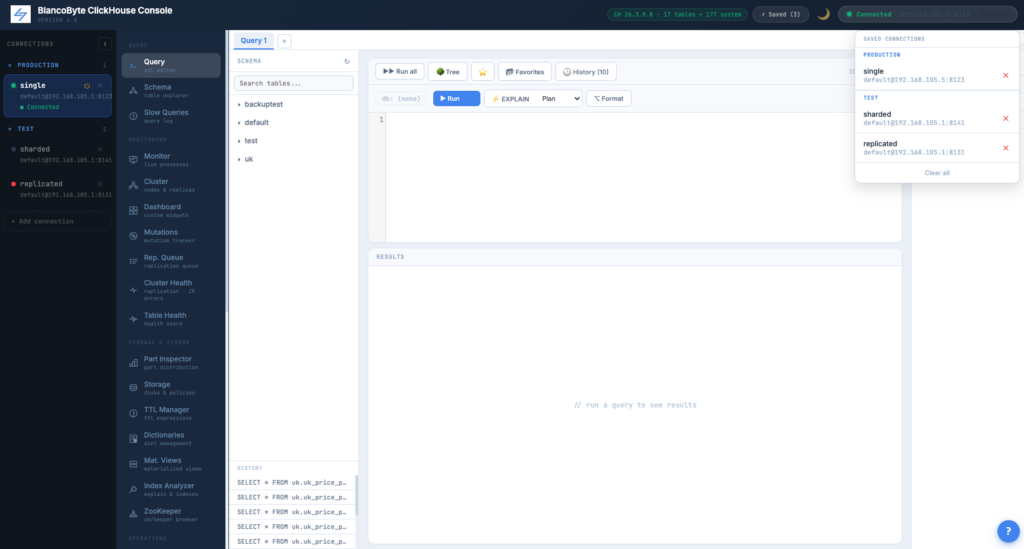
Folders for connection lists
If you manage more than a handful of ClickHouse clusters, the list of saved connections quickly becomes a wall of hostnames. Production, staging, performance lab, customer A’s environment, customer B’s environment, the dev cluster on your laptop — all jumbled together. The cost is not just visual: a tired operator at 23:47 can click the wrong line and find themselves connected to production when they meant to test something on staging. We’ve now added folders to the saved-connections list so each entry can carry a label like Production, Test, EU-West, or whatever convention your team uses.
When you save a connection, a Folder field appears next to the connection name with autocomplete from labels you’ve already used — so “production”, “Production”, and “PROD” don’t accidentally become three different folders. The Connections panel sidebar and the header Saved dropdown both render each folder as its own collapsible section, with named folders highlighted in accent blue and anything you haven’t tagged sitting under Ungrouped at the bottom. The labels are per-user — your “Production” and your colleague’s “Production” live in separate scopes; nobody sees anyone else’s list. And as with everything else in the saved connections table, the folder field is locator-only: no ClickHouse passwords were involved in the making of this feature.
SQL Editor — Persistent Tabs
Tabs are stored per-user in Postgres. Open the console from a different browser and the same SQL workspace is there. Each tab has its own SQL, result, and history. Survives logout, session expiry, and server restart.
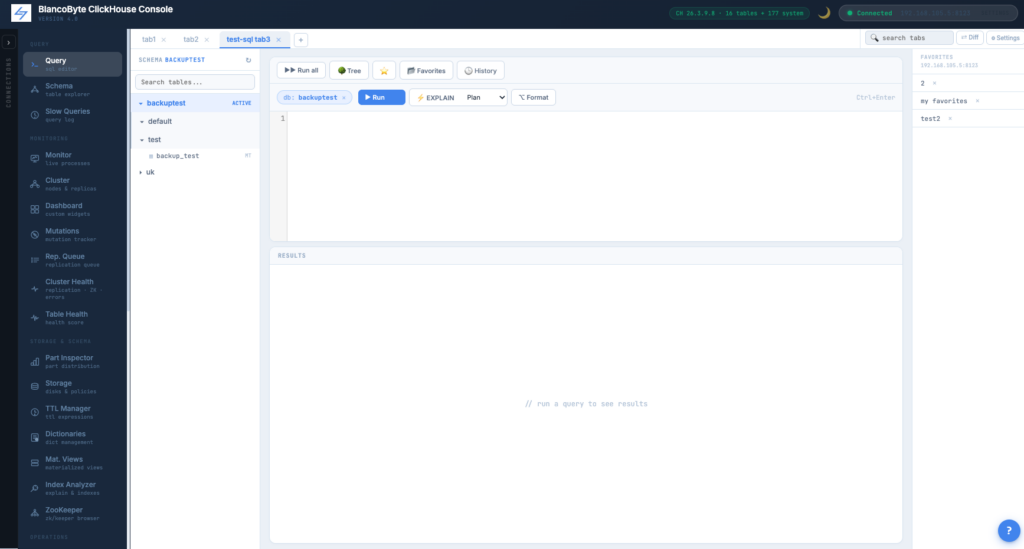
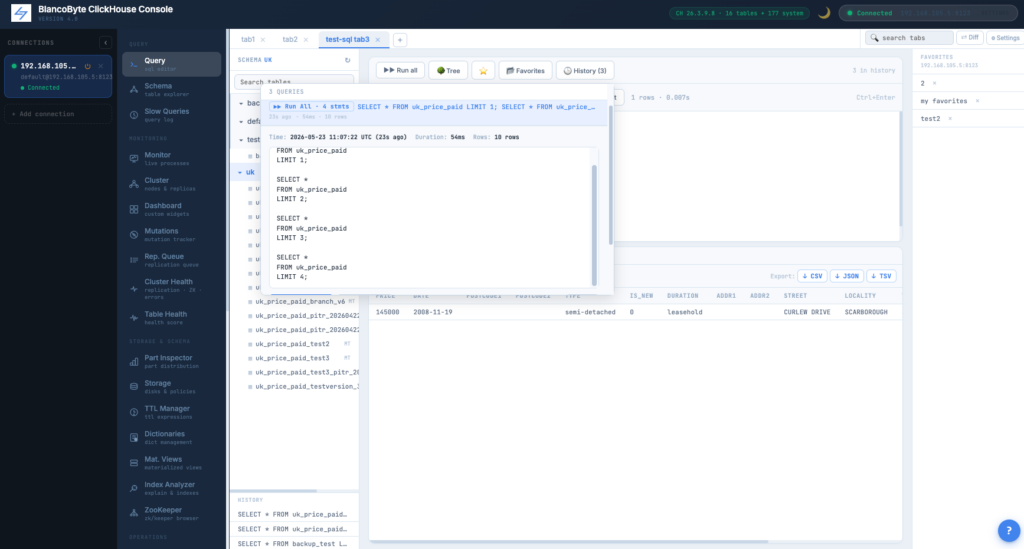
Query History
Per-user, persistent. Records timing, rows read, result row counts, and the cluster the query ran against. Filterable and searchable.
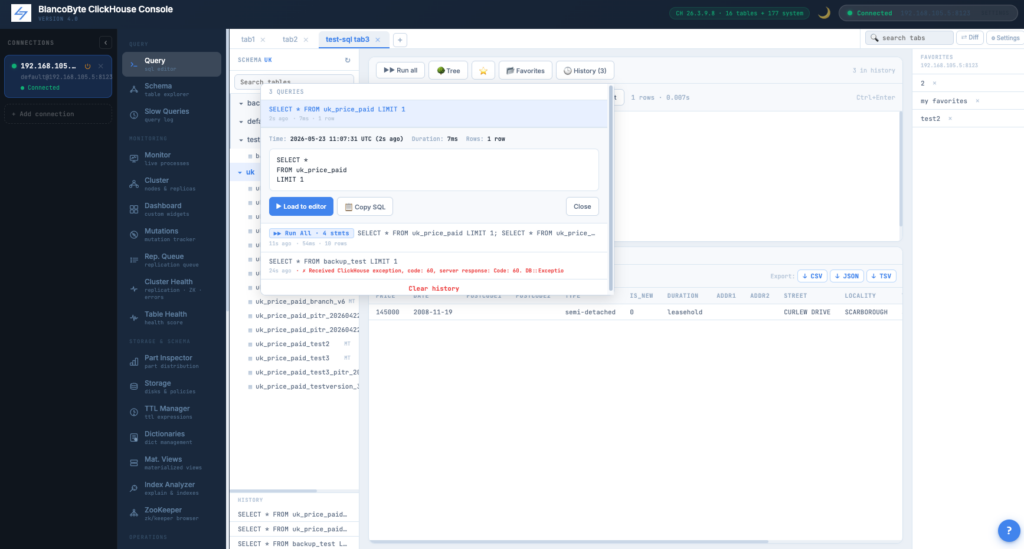
Saved Favorites
Per-user named queries, optionally organized in folders. Click to load into the editor.
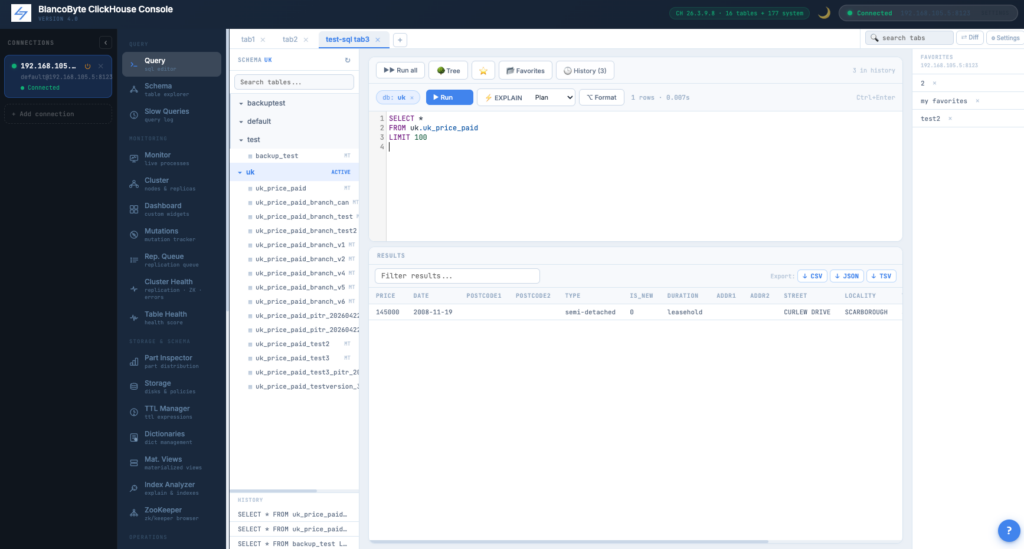
Multi-Statement Editor
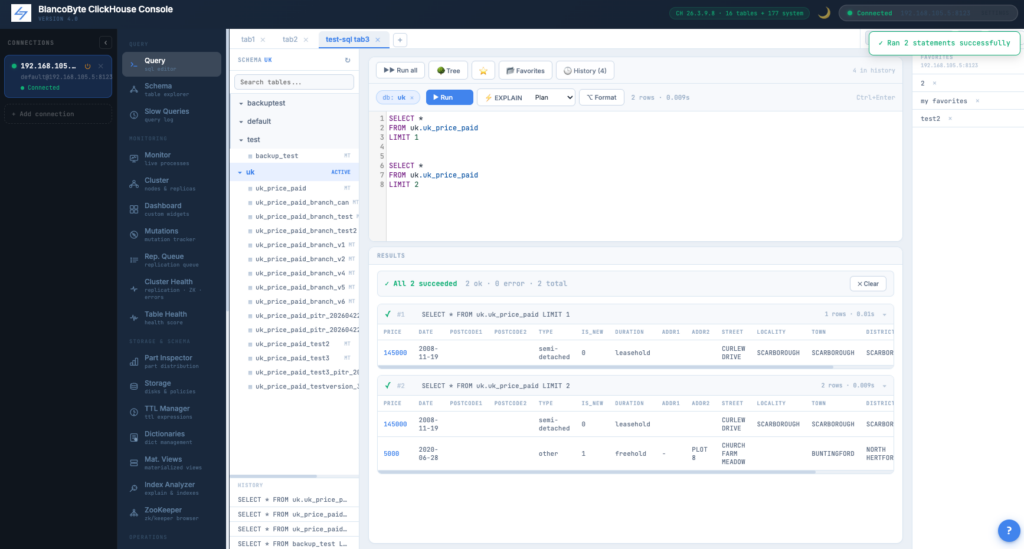
CodeMirror with syntax highlighting, line numbers, comment toggle. Cursor-aware execution: Ctrl+Enter runs the statement under your cursor; Run All runs them in sequence.
Result Filter and Sort
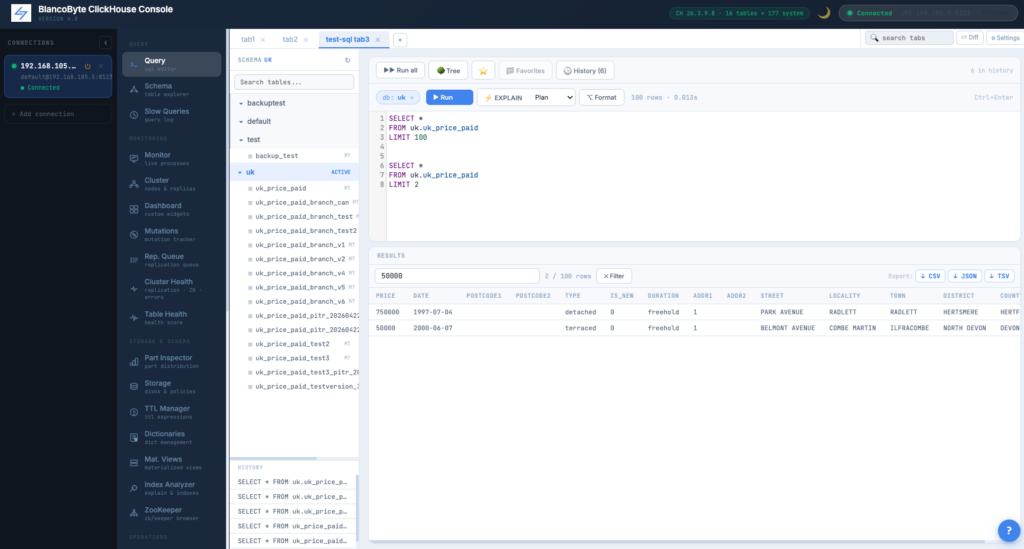
Inline filter narrows rows as you type. Column headers sort ascending / descending. Row counter shows filtered vs total. All client-side, no re-query.
Query Analyzer: from “it was slow” to “here’s why”
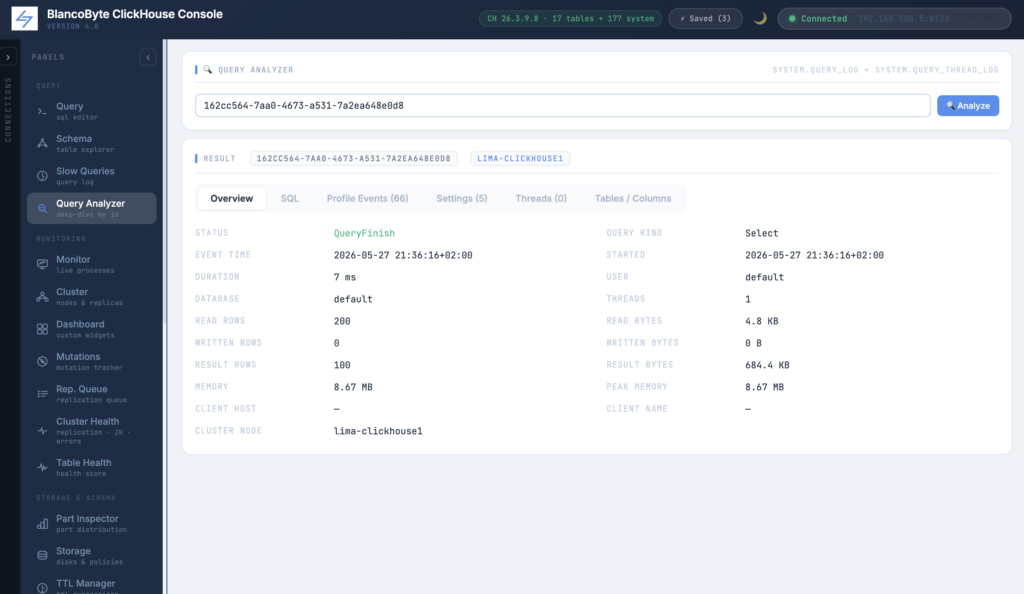
The Slow Query log tells you a query took 12 seconds and scanned 1.8 GB. Useful, but it stops at the symptom. The real questions start there: was the mark cache cold, or did the primary key just not help? Did the optimizer pick two threads when you expected eight? Did some setting silently override your defaults, halfway through a long-running session? Was there a dictionary lookup that fell back to a network call? ClickHouse already records the answers — in system.query_log, system.query_thread_log, the per-query ProfileEvents map, and a dozen other places. Reading them by hand is a few SQL queries and a lot of column knowledge. So we built a panel.
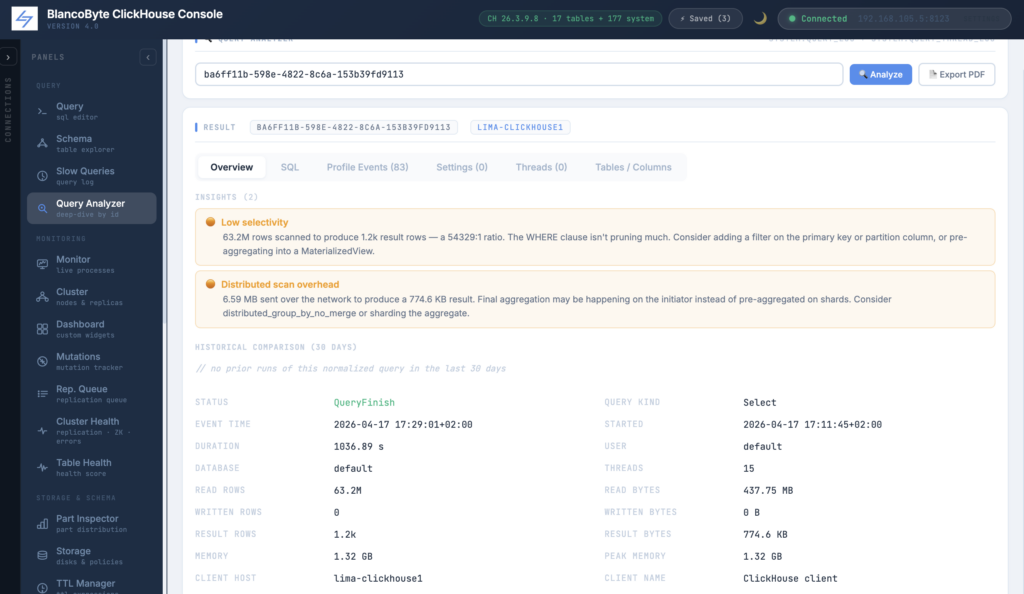
The new 🔍 Query Analyzer panel takes a single query_id and assembles every piece of evidence ClickHouse kept about that run. Six tabs: Overview (status, duration, scan stats, memory, exception), SQL (the full query and its normalized form), Profile Events (every one of ClickHouse’s 100+ per-query counters — MarkCacheHits, NetworkSendBytes, SelectedParts, OSCPUWaitMicroseconds — searchable), Settings (the actual runtime configuration the query saw, not the defaults), Threads (per-thread duration and memory from query_thread_log), and Tables / Columns (every database, table, column, function, dictionary, and storage the engine touched). Getting there is one click: when you finish a query, its query_id shows up as a clickable chip in the result stats footer — click it and you’re in the analyzer with the data pre-loaded. From the Slow Queries panel, every row has a 🔍 Analyze button doing the same. And if you have a query_id from somewhere else entirely — an incident ticket, a Slack thread, a server log — you can just paste it into the panel’s input. The lookup runs against the whole retained log; older queries aren’t penalised by a default time window.
Query Analyzer, smarter: insights, history, PDF
The Query Analyzer panel we shipped last month answered the “what did this query do?” question — six tabs of evidence from system.query_log and system.query_thread_log, complete and searchable. Feedback from operators landed on a clear gap: the data was there, but the interpretation wasn’t. A hundred Profile Event counters is not the same thing as a diagnosis. Knowing this run took 12 seconds doesn’t tell you whether 12 seconds is normal for this query. And opening the panel during an incident is one thing; pasting six tabs of evidence into a postmortem ticket afterwards is another. This update closes those three gaps.
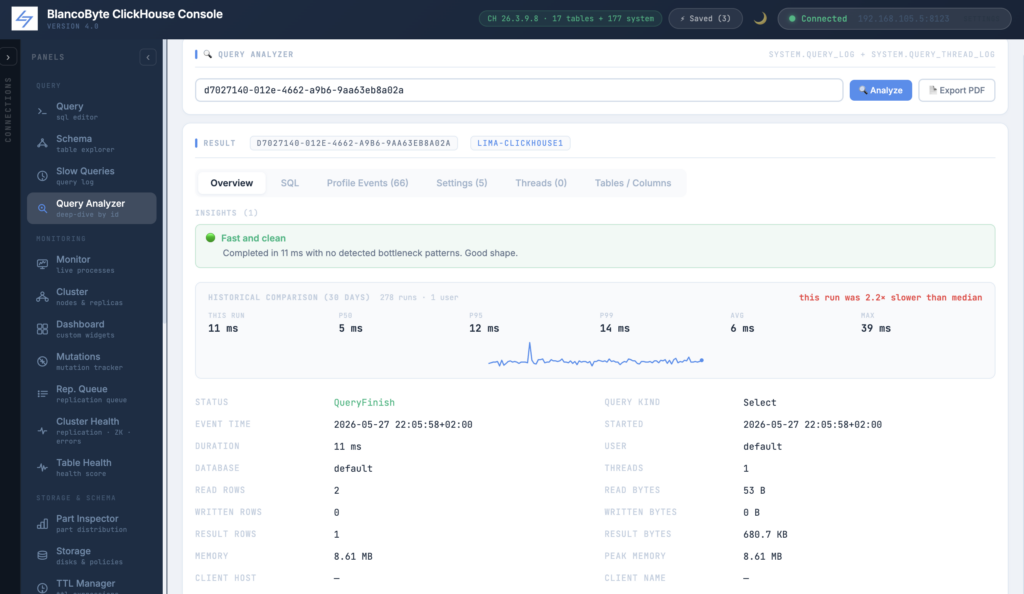
The first addition is an Insights block at the top of the Overview tab — a dozen deterministic rules that an experienced DBA would run mentally over the Profile Events and Settings. The rules flag the usual suspects and explain them in plain English: mark cache cold (with the hit/miss ratio), low selectivity (rows scanned vs returned, with the ratio), heavy per-row payload, partition pruning gaps, distributed scan overhead, IO-bound vs CPU-contended balance, memory spills to disk, parallelism disabled, low compression ratio. Each insight is one short paragraph, colour-coded (red for failure, orange for performance signals, green for reassurance), and grounded in numbers from the actual run — not a generic checklist. When nothing fires, a green “Fast and clean” stamp says so out loud. No AI; pure rules. The point is that an operator opening the panel during an incident sees, before anything else, a short list of “here’s what’s wrong” instead of having to derive that themselves from a hundred counters.
The second addition is Historical Comparison. Sitting underneath the insights, it answers the question “is this run unusual?” by looking up the query’s normalized_query_hash, aggregating the last thirty days of runs of that same normalized shape across the cluster, and reporting the count, p50, p95, p99, average, min, and max — with a one-line comparison (“this run was 3.2× slower than median”) and an inline sparkline of the last hundred runs. A query that’s always slow looks different from a query that’s normally fast but spiked once; this card tells you which kind you’re looking at, which is usually the first step in deciding what to do about it. The lookup is silent on failure — if the query is one-off and has no history, the card just says so and the rest of the panel renders normally.
The third addition is a one-click 📄 Export PDF button in the panel header. It opens a print-friendly HTML rendering of everything the analyzer just showed — header, insights, history stats, the overview key/value table, the SQL, every non-zero profile event, every setting, the thread breakdown, the touched databases/tables/columns/functions/dictionaries — in a single document, and triggers the browser’s native print dialog so the operator saves it as PDF with one keystroke. No new server dependency, no headless Chrome, no jsPDF blob; just print CSS done well. The result is something you can attach to an incident ticket, drop into a postmortem template, or send to a vendor without first taking eight screenshots. Every export is audited as an Export Analyzer Report event with the calling user, the inspected query_id, and the timestamp, alongside the existing Analyze Query events.
Result Export
CSV, JSON, TSV — directly from the toolbar, no server round-trip.
Query Formatter
One-click reformat: clauses on their own lines, AND/OR indented, columns broken at commas, keywords uppercased. Browser-only, instant. Selection-aware.
EXPLAIN
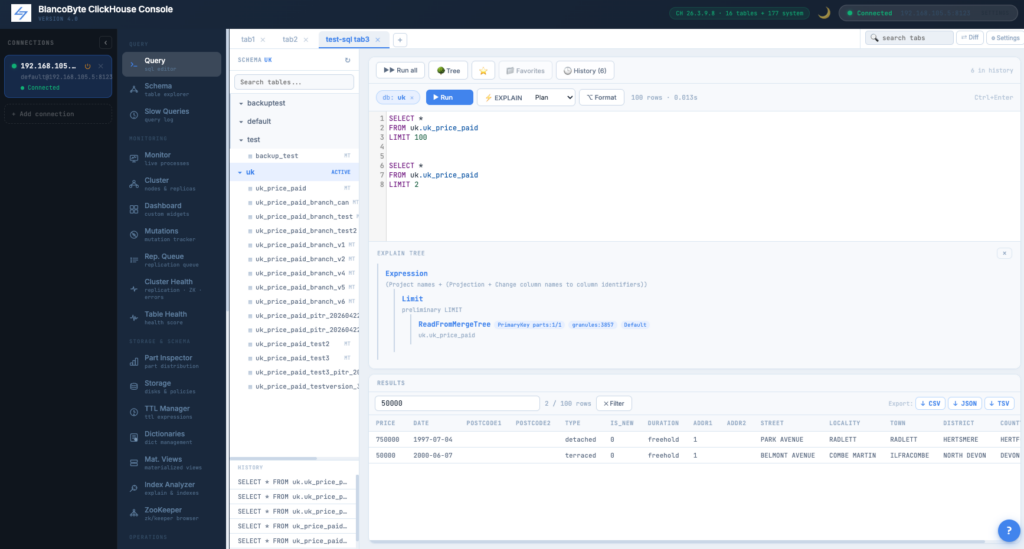
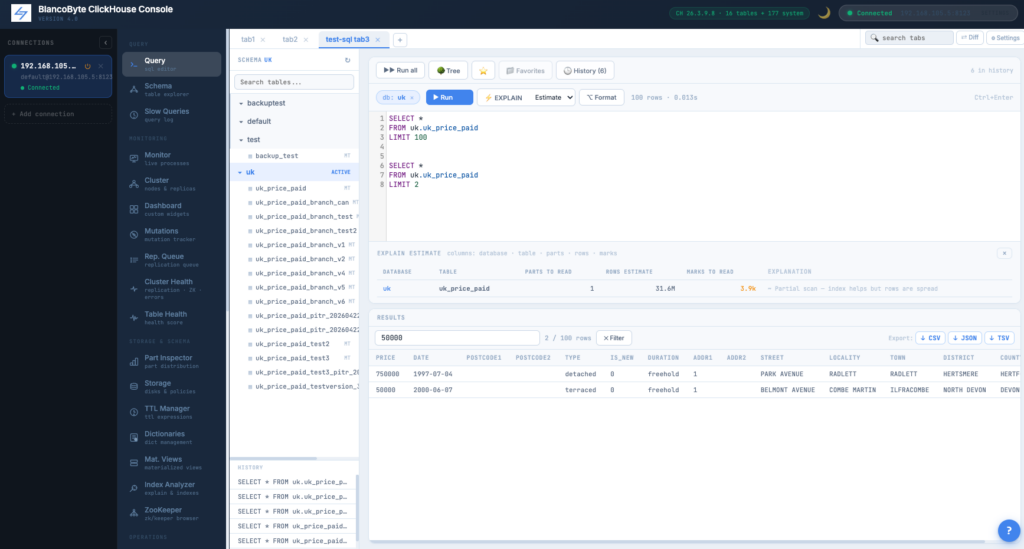
A deliberate button next to Run with three modes: Plan, Pipeline, Estimate. Never fires automatically. Output appears inline below the editor.
Cost Estimator: see what a query will scan, before you run it
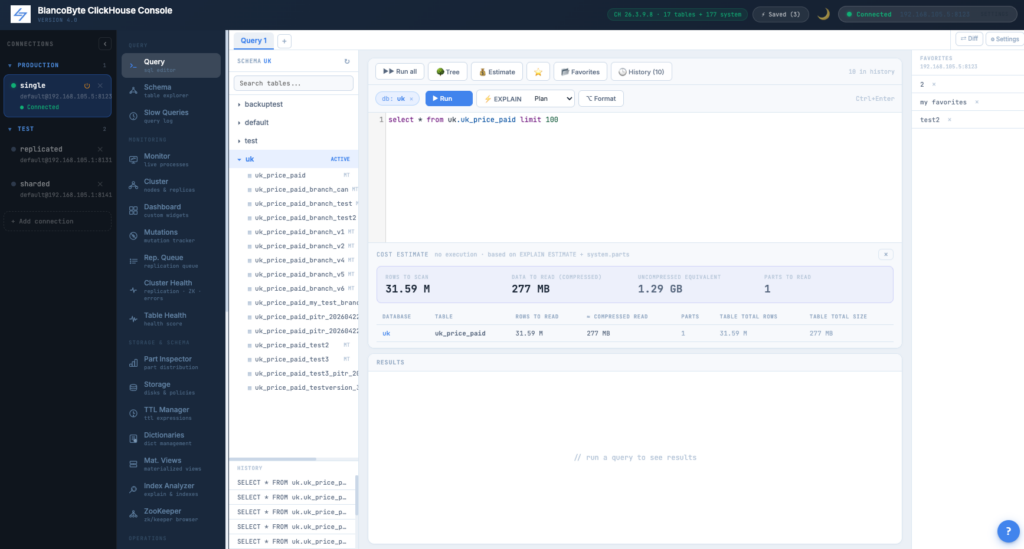
It’s Monday morning. A BI analyst pastes a query into the editor — something exploratory, no WHERE filter on the date column, just SELECT * from a fact table they’re not entirely sure of the size of. They click Run. Twenty seconds later memory pressure spikes across two replicas and an ops engineer is asking in Slack what’s happening. We’ve all been on one side or the other of this story, and the awkward truth is: nothing about a written-but-not-yet-run query tells you how much data it’s going to read. ClickHouse has EXPLAIN ESTIMATE for exactly this question, but reading raw EXPLAIN output is a developer skill, not a casual-analyst skill. So we built a button.
Hit the new 💰 Estimate button next to the editor’s EXPLAIN controls and a card slides in with the answer: rows to scan, compressed bytes that will be read off disk, uncompressed equivalent, parts touched, and a per-table breakdown showing how much of each table the query will sweep. The query itself never executes — the estimate is computed from ClickHouse’s optimizer (EXPLAIN ESTIMATE) enriched with metadata from system.parts, so the round trip is around 50-150ms and adds essentially zero load on the cluster. Heavy queries (over 1 GB or 100 M rows) get a soft orange band and a one-line suggestion about adding a primary-key filter or a materialized view, but nothing blocks Run — this tool exists to inform, not to nag. The estimate appears only when you ask for it, and disappears when you dismiss it. No auto-popups, no “are you sure” modals on Run, no opinion about your work. Just the answer to “how heavy is this?”, on click.
ClickHouse Settings Overrides
The Settings panel reads system.settings and lets you override any value for the current session. Overrides are now persisted per-user — reloading the page no longer wipes them.
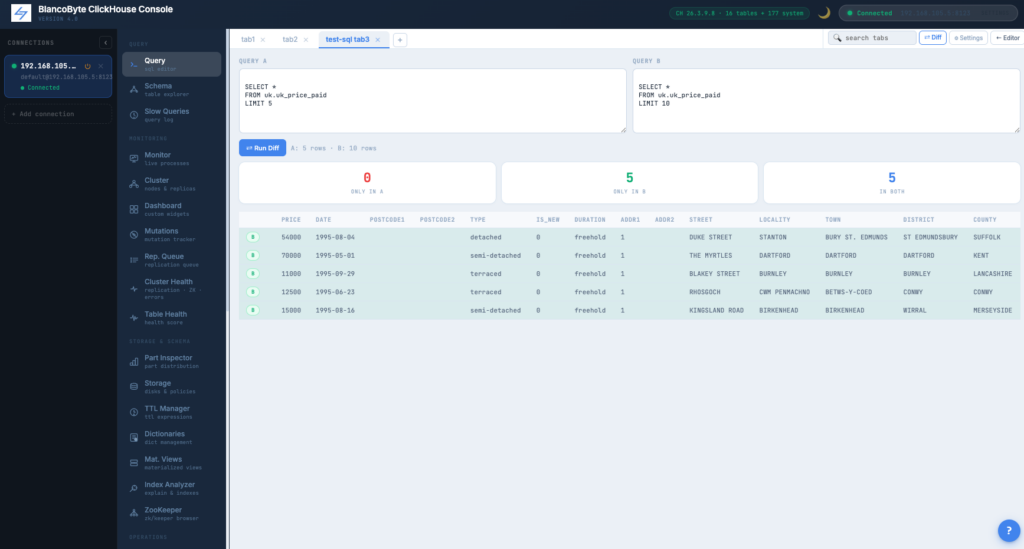
Table Diff
Two queries, run in parallel, results compared client-side. Rows only in A in red, only in B in green, identical rows counted. Useful alongside branching for verifying migrations.
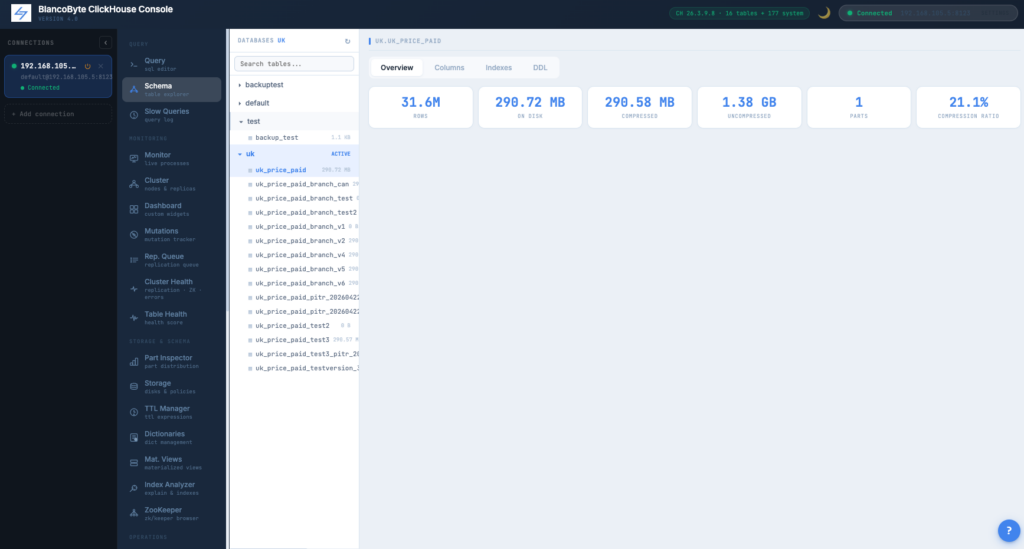
Schema Explorer
Multi-DB tree on the left, four-tab table detail on the right: Overview (rows, sizes, parts, date range), Columns (types, codecs, key membership flags), Indexes (data-skipping indexes), DDL (full CREATE TABLE with copy button).
Materialized View Manager
Dependency graph showing which MVs feed which tables, with the SELECT body for each. Surfaces hidden ingestion paths a schema-only view can’t.
Index and Projection Analyzer
Runs three EXPLAIN variants — PLAN, PIPELINE, ESTIMATE — and badges whether a projection was used and whether index skipping fired. Immediate “is this query using the primary index” answer.
TTL Inspector
Per-table TTL clauses with effective evaluation dates. Spot tables retaining more than the policy says they should.
Part Inspector
Structured view of system.parts organized by partition. Per-partition: count, rows, size, compression ratio. Expand any partition for individual parts: type, marks, active and frozen flags, TTL boundaries.
ZooKeeper / Keeper Browser
Tree browser for system.zookeeper. Navigate replication paths, leader election state, queue contents of a stuck replica. Read-only by design.
Dictionary Management
Live view of every dictionary: status, type, source, element count, memory, last update. Per-dictionary Reload, Reload All, failed dictionaries highlighted in red.
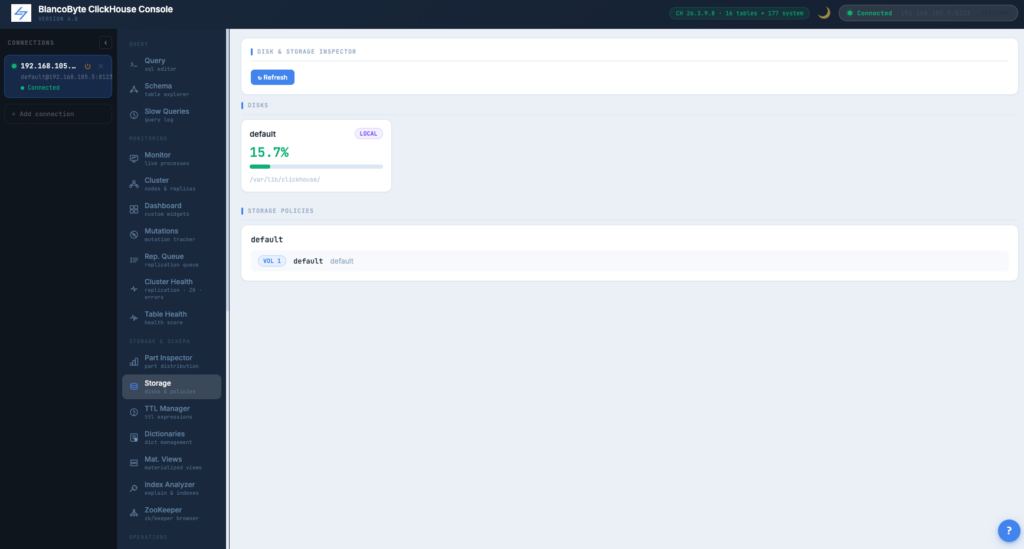
Disk and Storage Inspector
Each disk as a card with fill percentage, used and free space, path. Storage policies shown as a tree of volumes and disks with the tables using each.
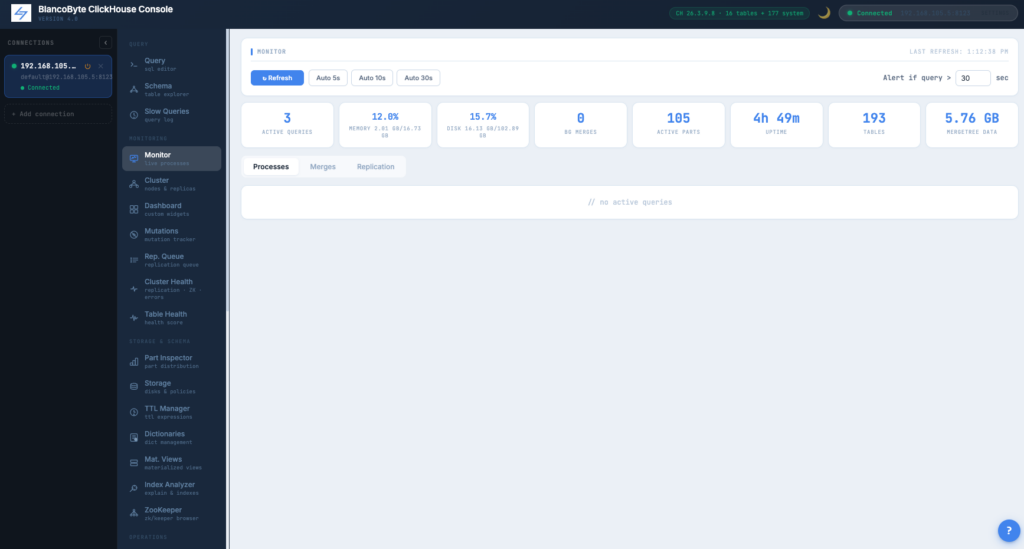
Monitor Panel
Live metrics dashboard reading from system.metrics and system.asynchronous_metrics: memory, disk, active queries, background merges, parts, uptime, table count, data size.
Process List
Every running query with user, elapsed time, rows, memory. Per-query Kill button issues KILL QUERY.
Merge Queue
Every active merge with its table, elapsed time, progress bar, part count, type (merge or mutation).
Replication Queue
Pending entries, currently executing, retries, exception messages — per-replica. Surfaces stuck replicas before they become a critical alert.
Mutation Tracker
system.mutations with parts-done-to-remaining ratio, progress bar, stuck mutations flagged with their failure reason. Per-mutation Kill button. Filter by database / table.
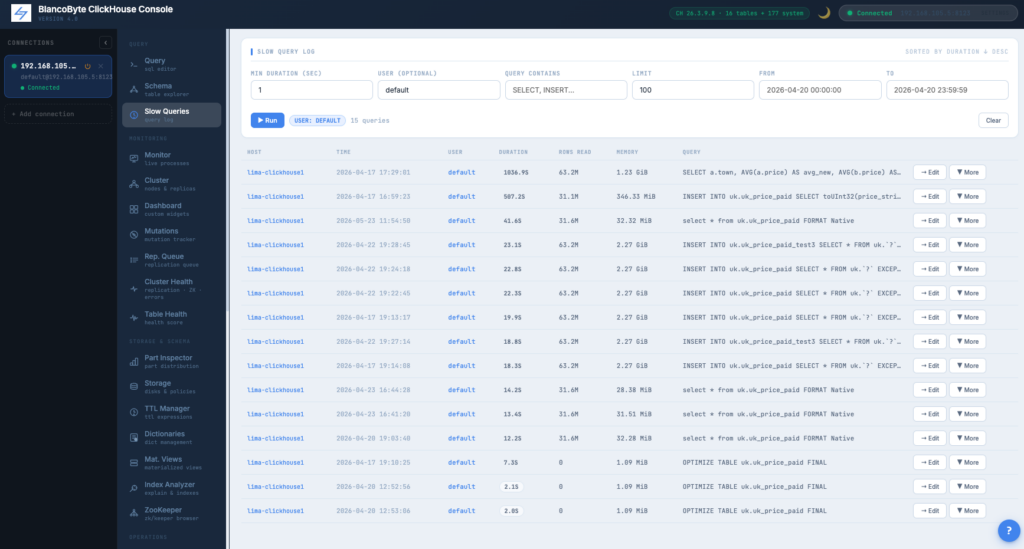
Slow Query Log
Reads system.query_log server-side with filters for duration, user, query content, time range. Sorted by duration descending. One click to load any query into the editor.
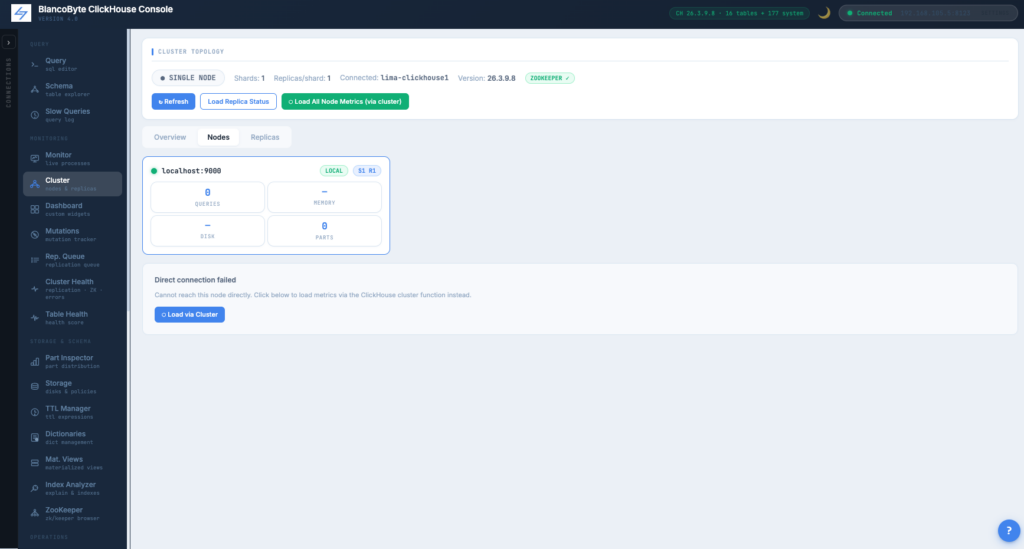
Cluster Overview
Auto-detected topology from system.clusters and system.replicas. Per-shard, per-replica view. Highlights the node you’re connected to.
Cluster-Wide Node Metrics
Uses clusterAllReplicas() to collect per-node metrics through the node you’re already connected to. No need to open ports or expose internal hostnames.
Cluster Health
Replication state per replicated table, mutation queue depth, slow-query leaderboard, active merges, ZooKeeper/Keeper status — single panel.
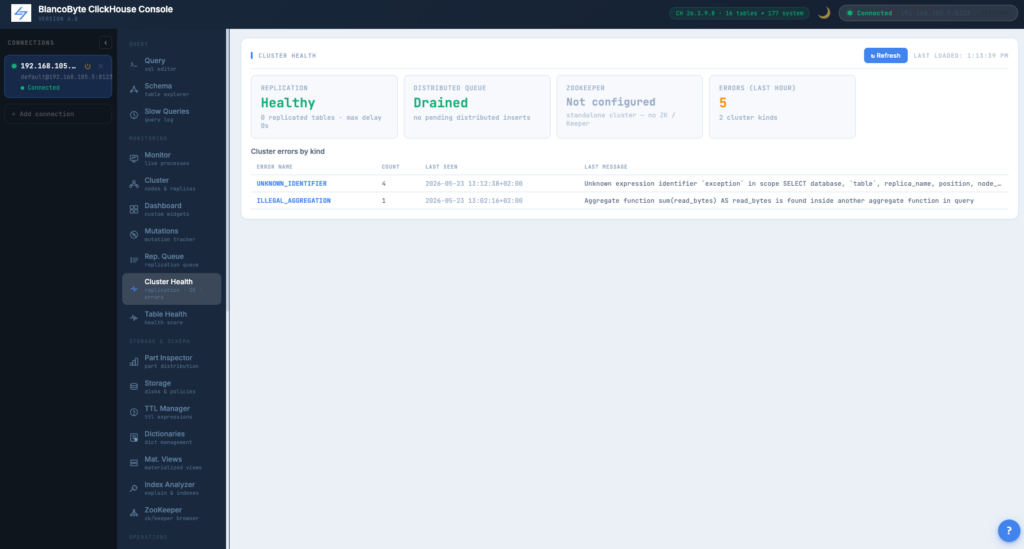
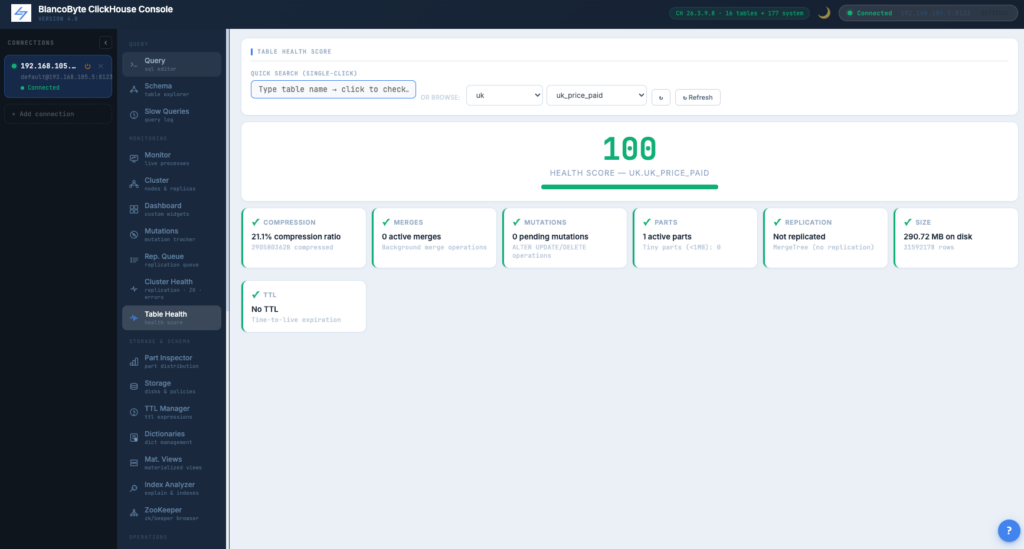
Table Health Score
Six diagnostic checks per table — part count, compression, merges, replication delay, mutations, TTL — combined into a 0–100 score with per-check cards.
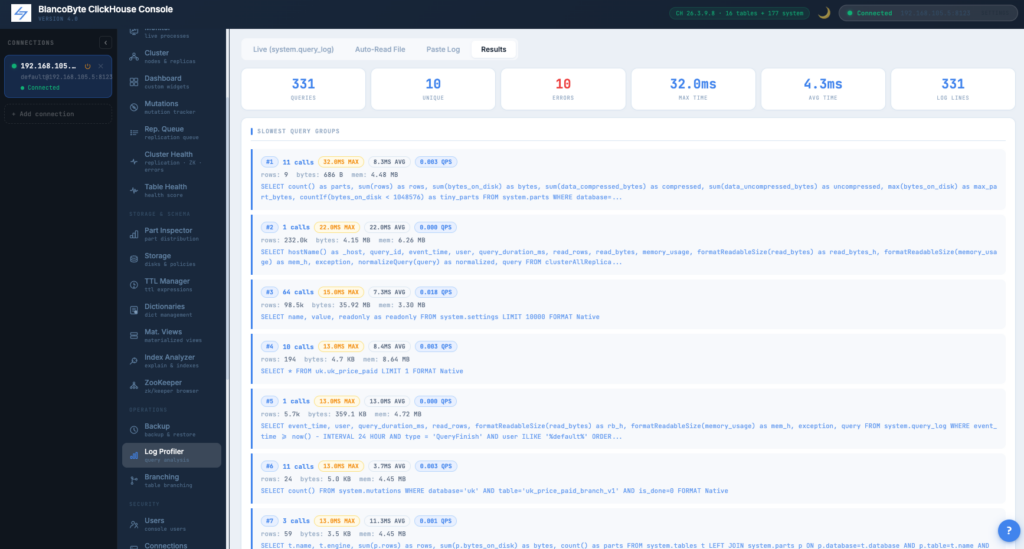
Log Profiler
Parse the ClickHouse server log, group by query pattern, sort by any metric. Filters: duration window, user, host, regex, time range, errors-only, completed-only, min call count. Auto-read tab pulls directly from the server; paste tab accepts raw log text.
Profiler Exports
Five formats from the results tab: HTML (interactive), JSON, CSV, plain text, Markdown. All exports apply current filters and sort.
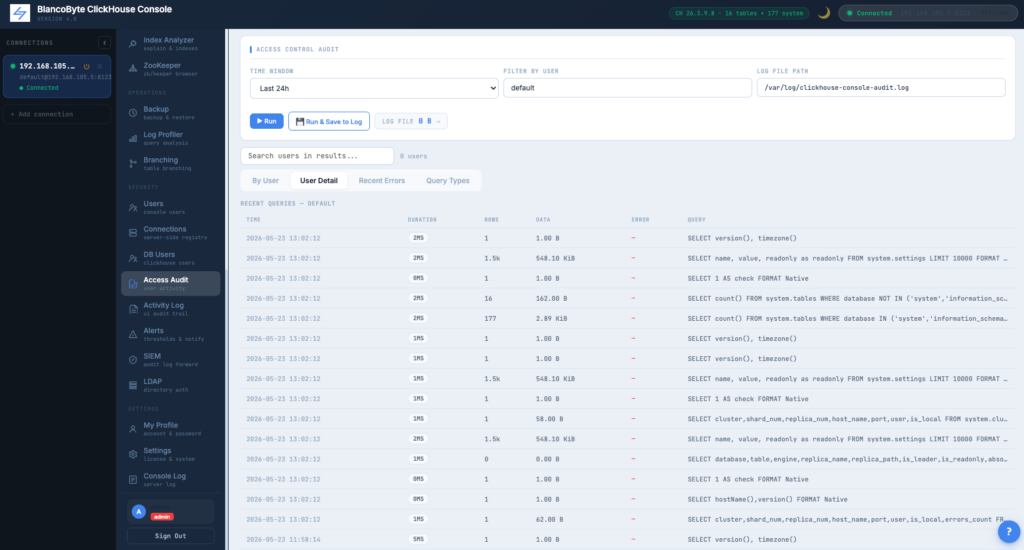
Access Control Audit
Reads system.query_log and produces a structured per-user activity report. By User tab: query count, errors, execution time, data read, memory. Query Types tab: SELECT / INSERT / ALTER / DROP / CREATE / SYSTEM breakdown for spotting unexpected DDL.
Branching
Read-safe table copies via FREEZE + CREATE TABLE AS + ATTACH PART. Branch list persists across sessions; every branch operation is audited.
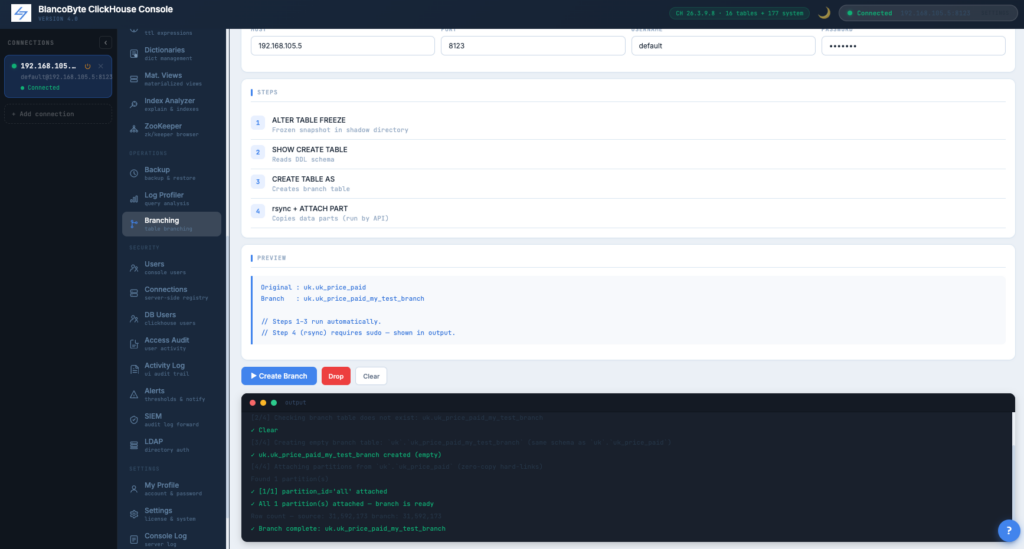
Multi-Shard Branching
Branch operations against sharded clusters fan out to the right shard automatically.
ClickHouse User Management
Users, roles, and grants — managed directly through the UI. Requires the console admin role; every action is audited; credentials used come from the encrypted connection registry.
Custom Dashboards
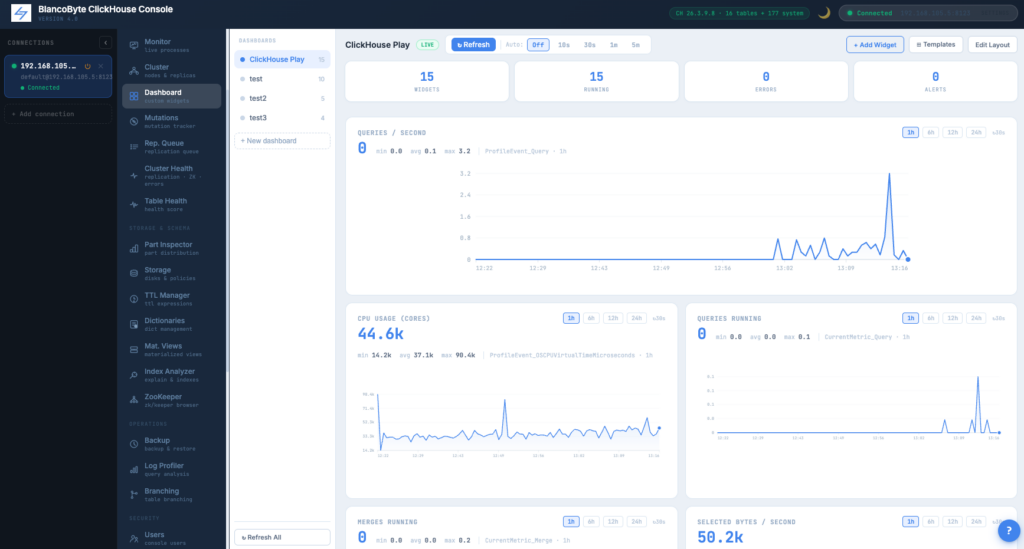
SQL-driven widgets: metric card, sparkline, progress bar, table. Stored per-user in Postgres so dashboards survive browser changes. Independent refresh intervals, optional alert thresholds, multiple named dashboards switchable from the sidebar.
Alerts and Notifications
Threshold-based monitoring: disk, memory, long-running queries, replication queue. Per-rule cooldown so a noisy alert doesn’t suppress a quiet one. Alert history persistent in Postgres.
Notification Channels
Slack, Microsoft Teams, Discord, generic JSON webhook, and SMTP email with STARTTLS. Test button per channel.
Console Log
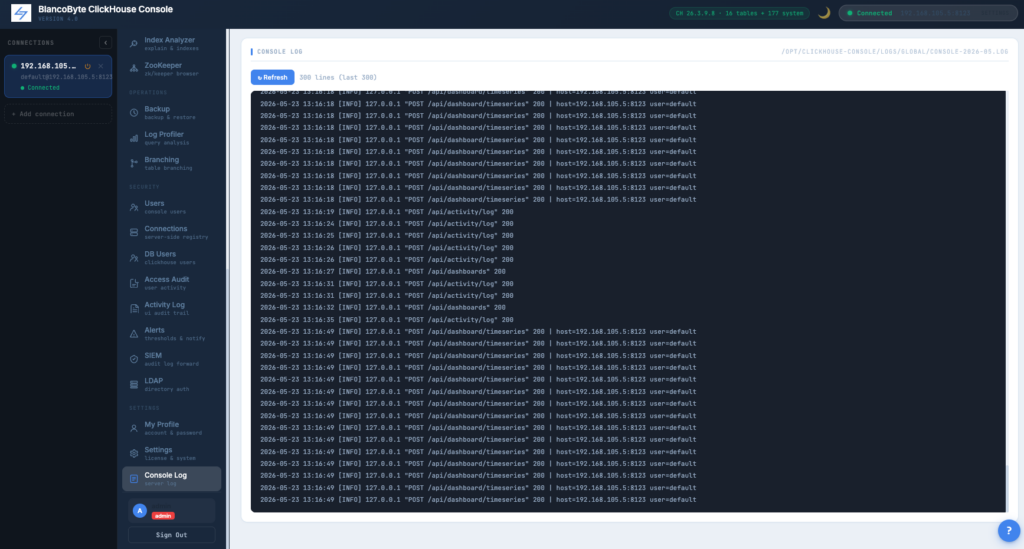
The on-disk operational log from v1, still there: structured records with timestamps, IPs, job IDs, SQL previews, exit codes, color-coded by severity. Last 300 lines on demand from the UI; logtail.sh for streaming; logrotate for retention.
Dark / Light Theme
One-button switch in the header. Preference saved per browser. SQL editor highlighting follows: Dracula in dark, default CodeMirror in light.
Hardened Deployment
The installer creates a dedicated unprivileged user, a systemd unit running gunicorn behind Nginx with HTTPS, a self-signed TLS certificate for first boot, and applies database migrations idempotently. A single ./deploy/update.sh release.zip command applies subsequent versions.
Installation Guide
One document covering prerequisites, the backing services (Postgres, Redis), ClickHouse-side configuration including <backups><allowed_path>, the installer itself, and post-install operations.
Security Whitepaper
Threat model, credential vault, audit pipeline, SIEM forwarder, LDAP integration, privileged-operations matrix, dedicated chapter for the backup feature’s security model, hardening recommendations, and explicit in-scope / customer-responsibility lists. Intended for the people asked to sign off on the deployment.
BlancoByte ClickHouse Console v4 is a substantial rebuild on top of the v1 foundation. If your ClickHouse setup has grown past one cluster, one operator, or one trust boundary, this release is for you.
— The BlancoByte Team